! - Some images may appear smaller than intended, click on images to enlarge them in a new tab.
Number Concepts
Over the semester, my understanding of number concepts have drastically improved. I believe that my main point of improvement is terminology for number concepts. This is because there were a lot of topics covered in these units that I was unaware in terms of naming. I also learnt the importance of showing my work when working with some of these newer concepts, as it helps compare and find issues in answers to longer, more complex questions.
Exponents and Exponent Rules
Earlier this year, we dove deep into the concept of exponents, with many different types being included.
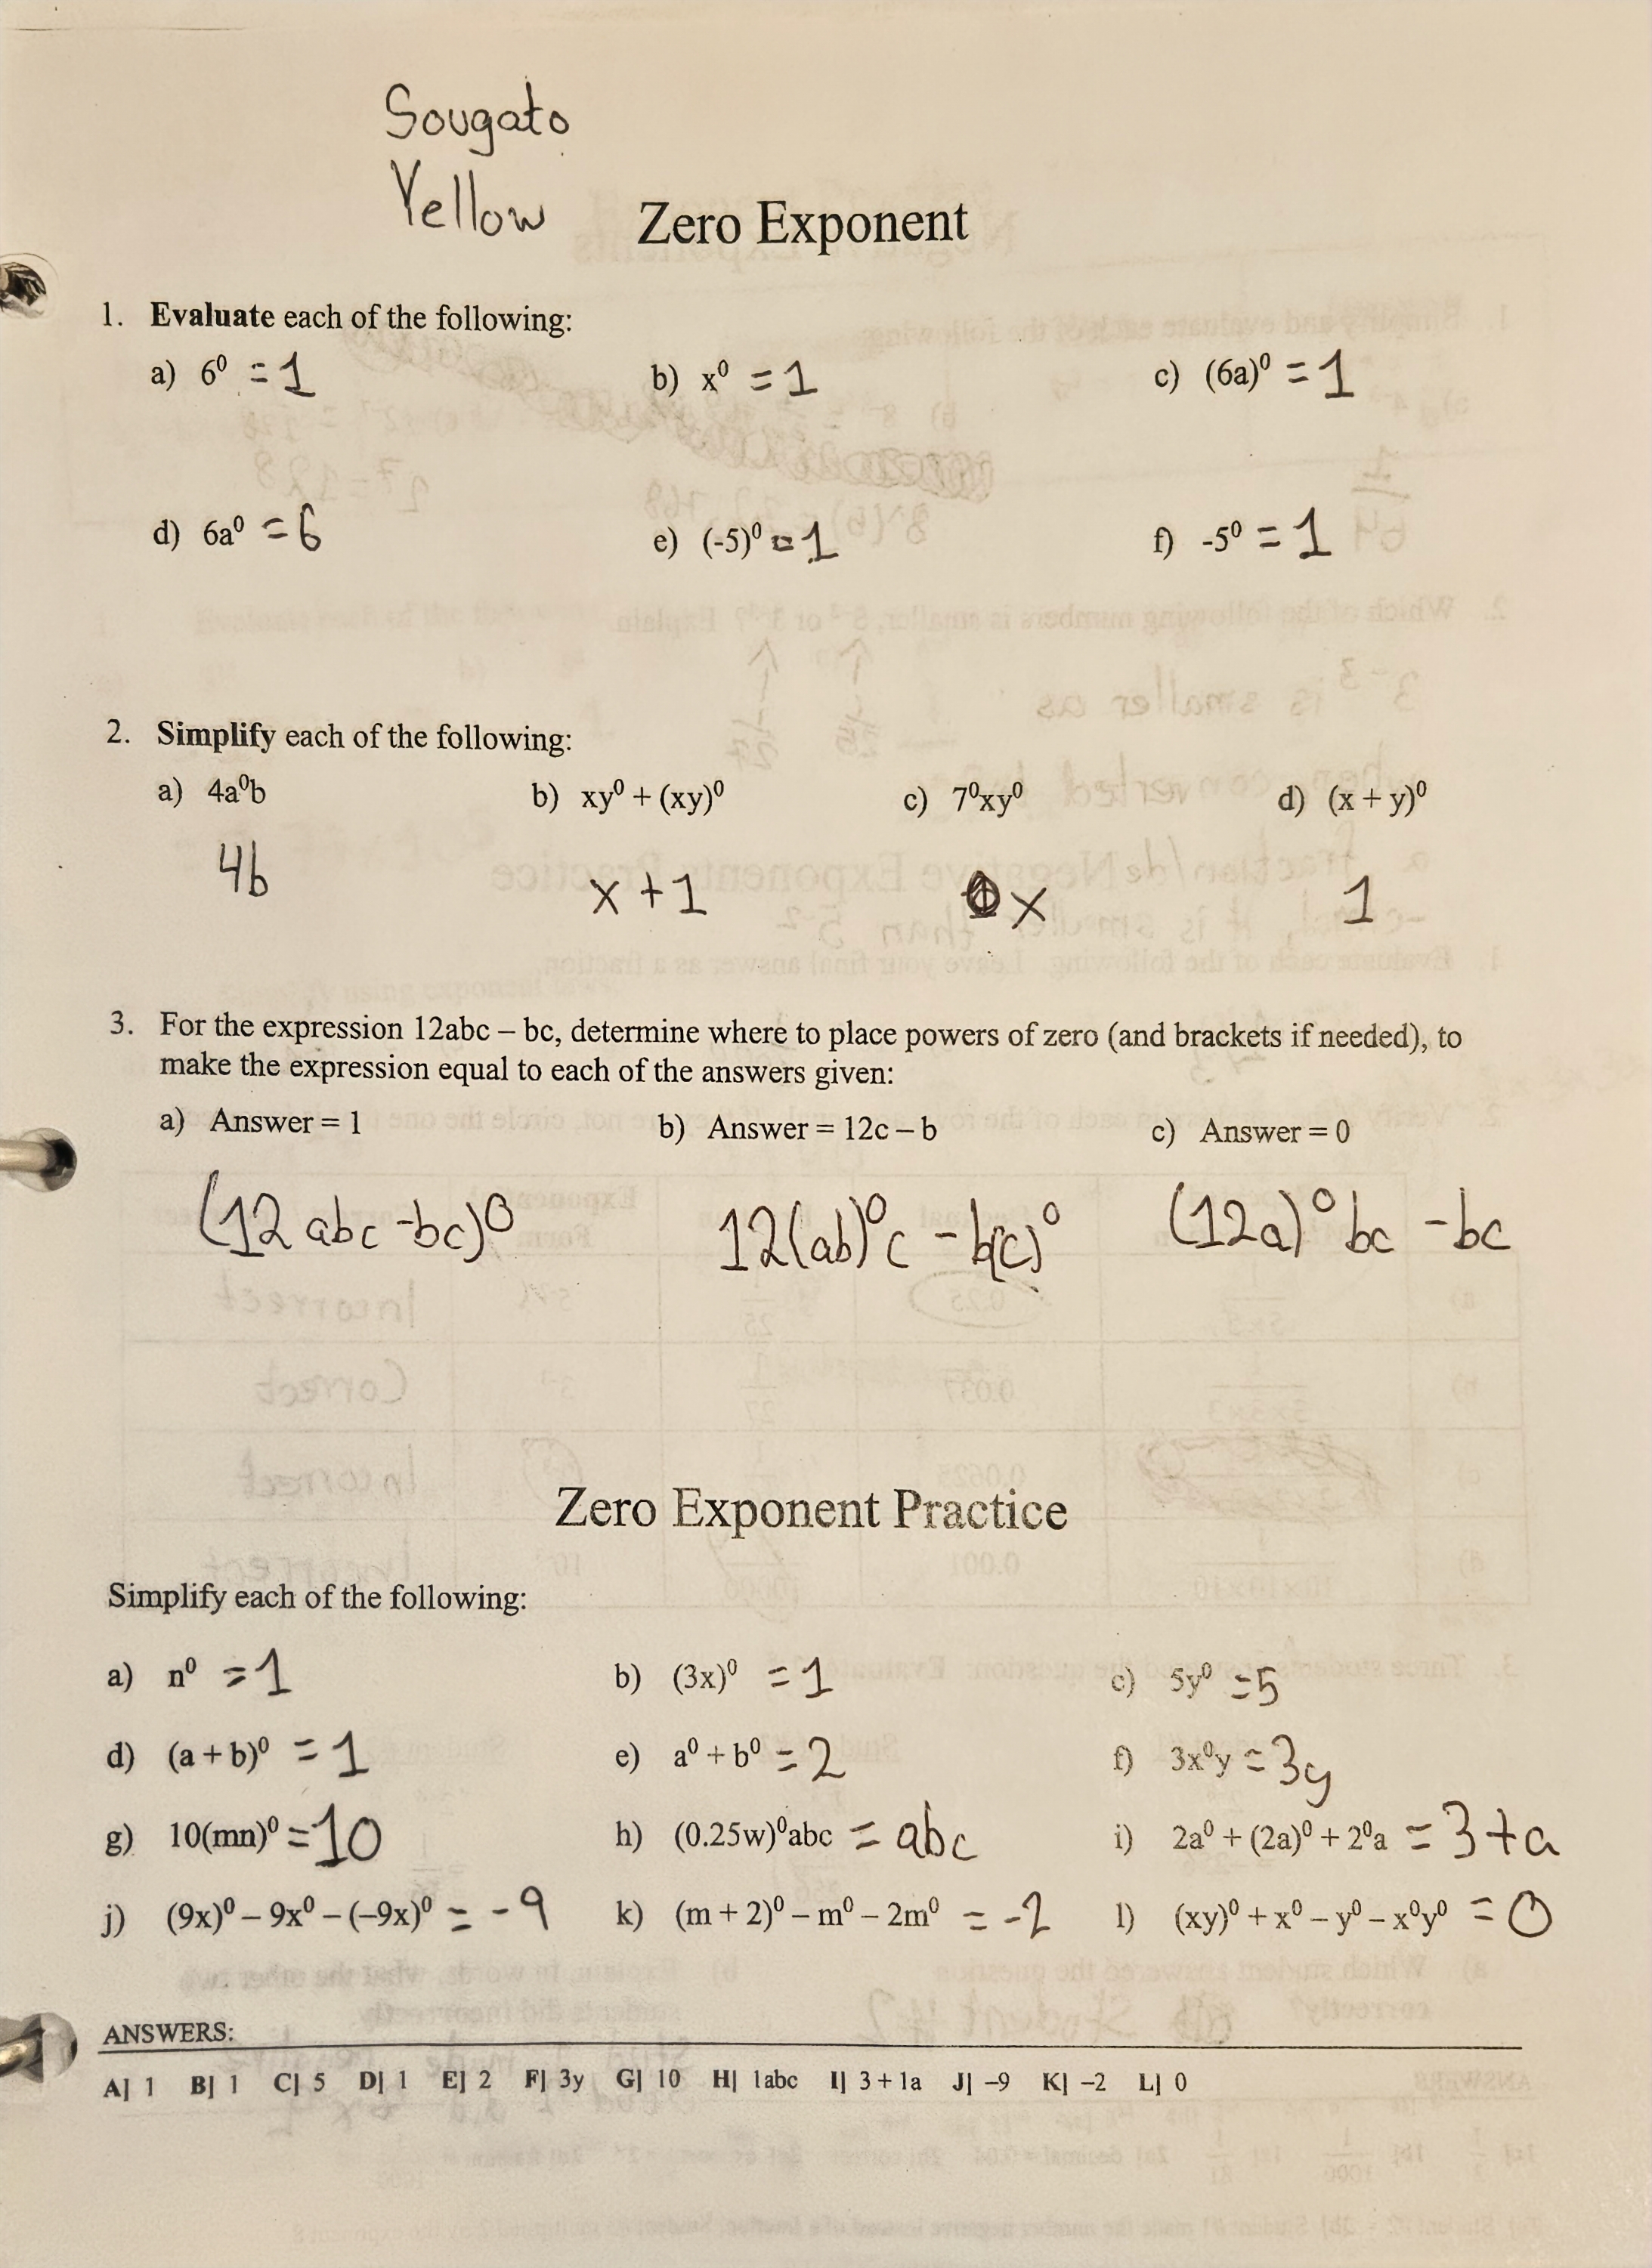
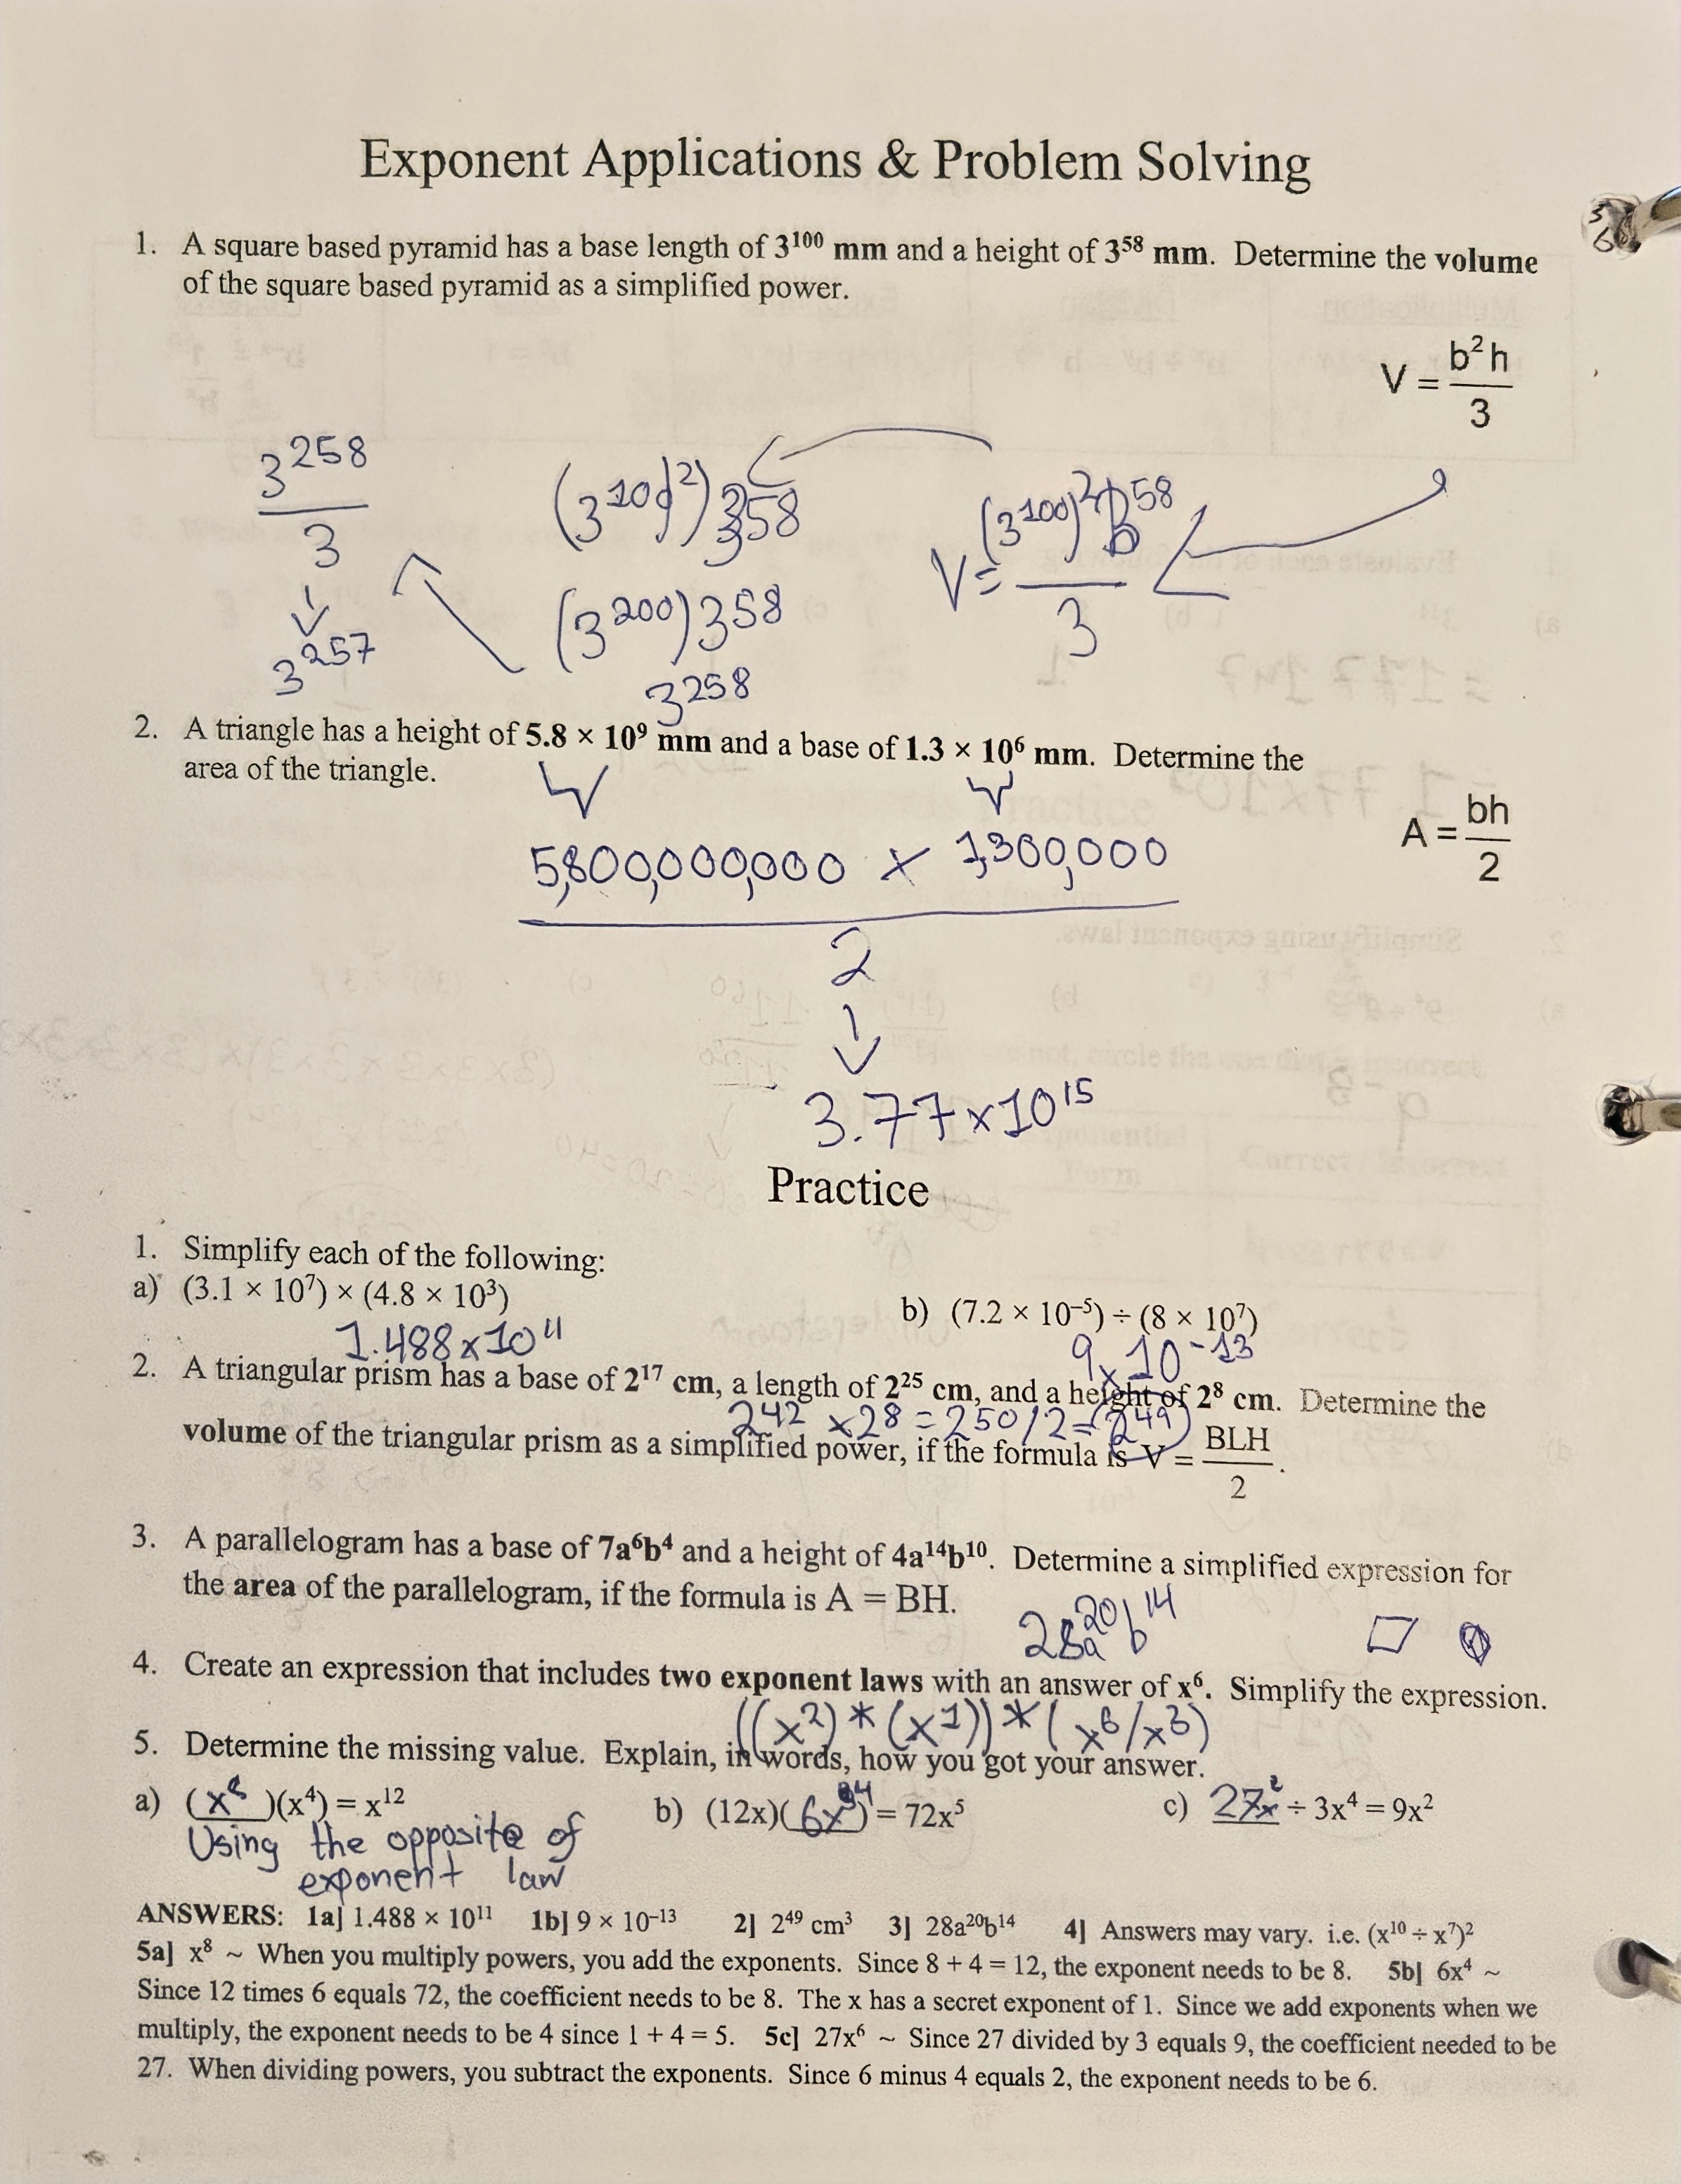
Zero Exponents - the idea of using zero exponents essentially means that a number is being multiplied by itself 0 times, making it undefined. This leaves us with an answer of one, regardless of the number being raised to a power In the first image above, the practice shows my demonstration of zero exponents used in direct questions, as well as expressions using zero exponents.
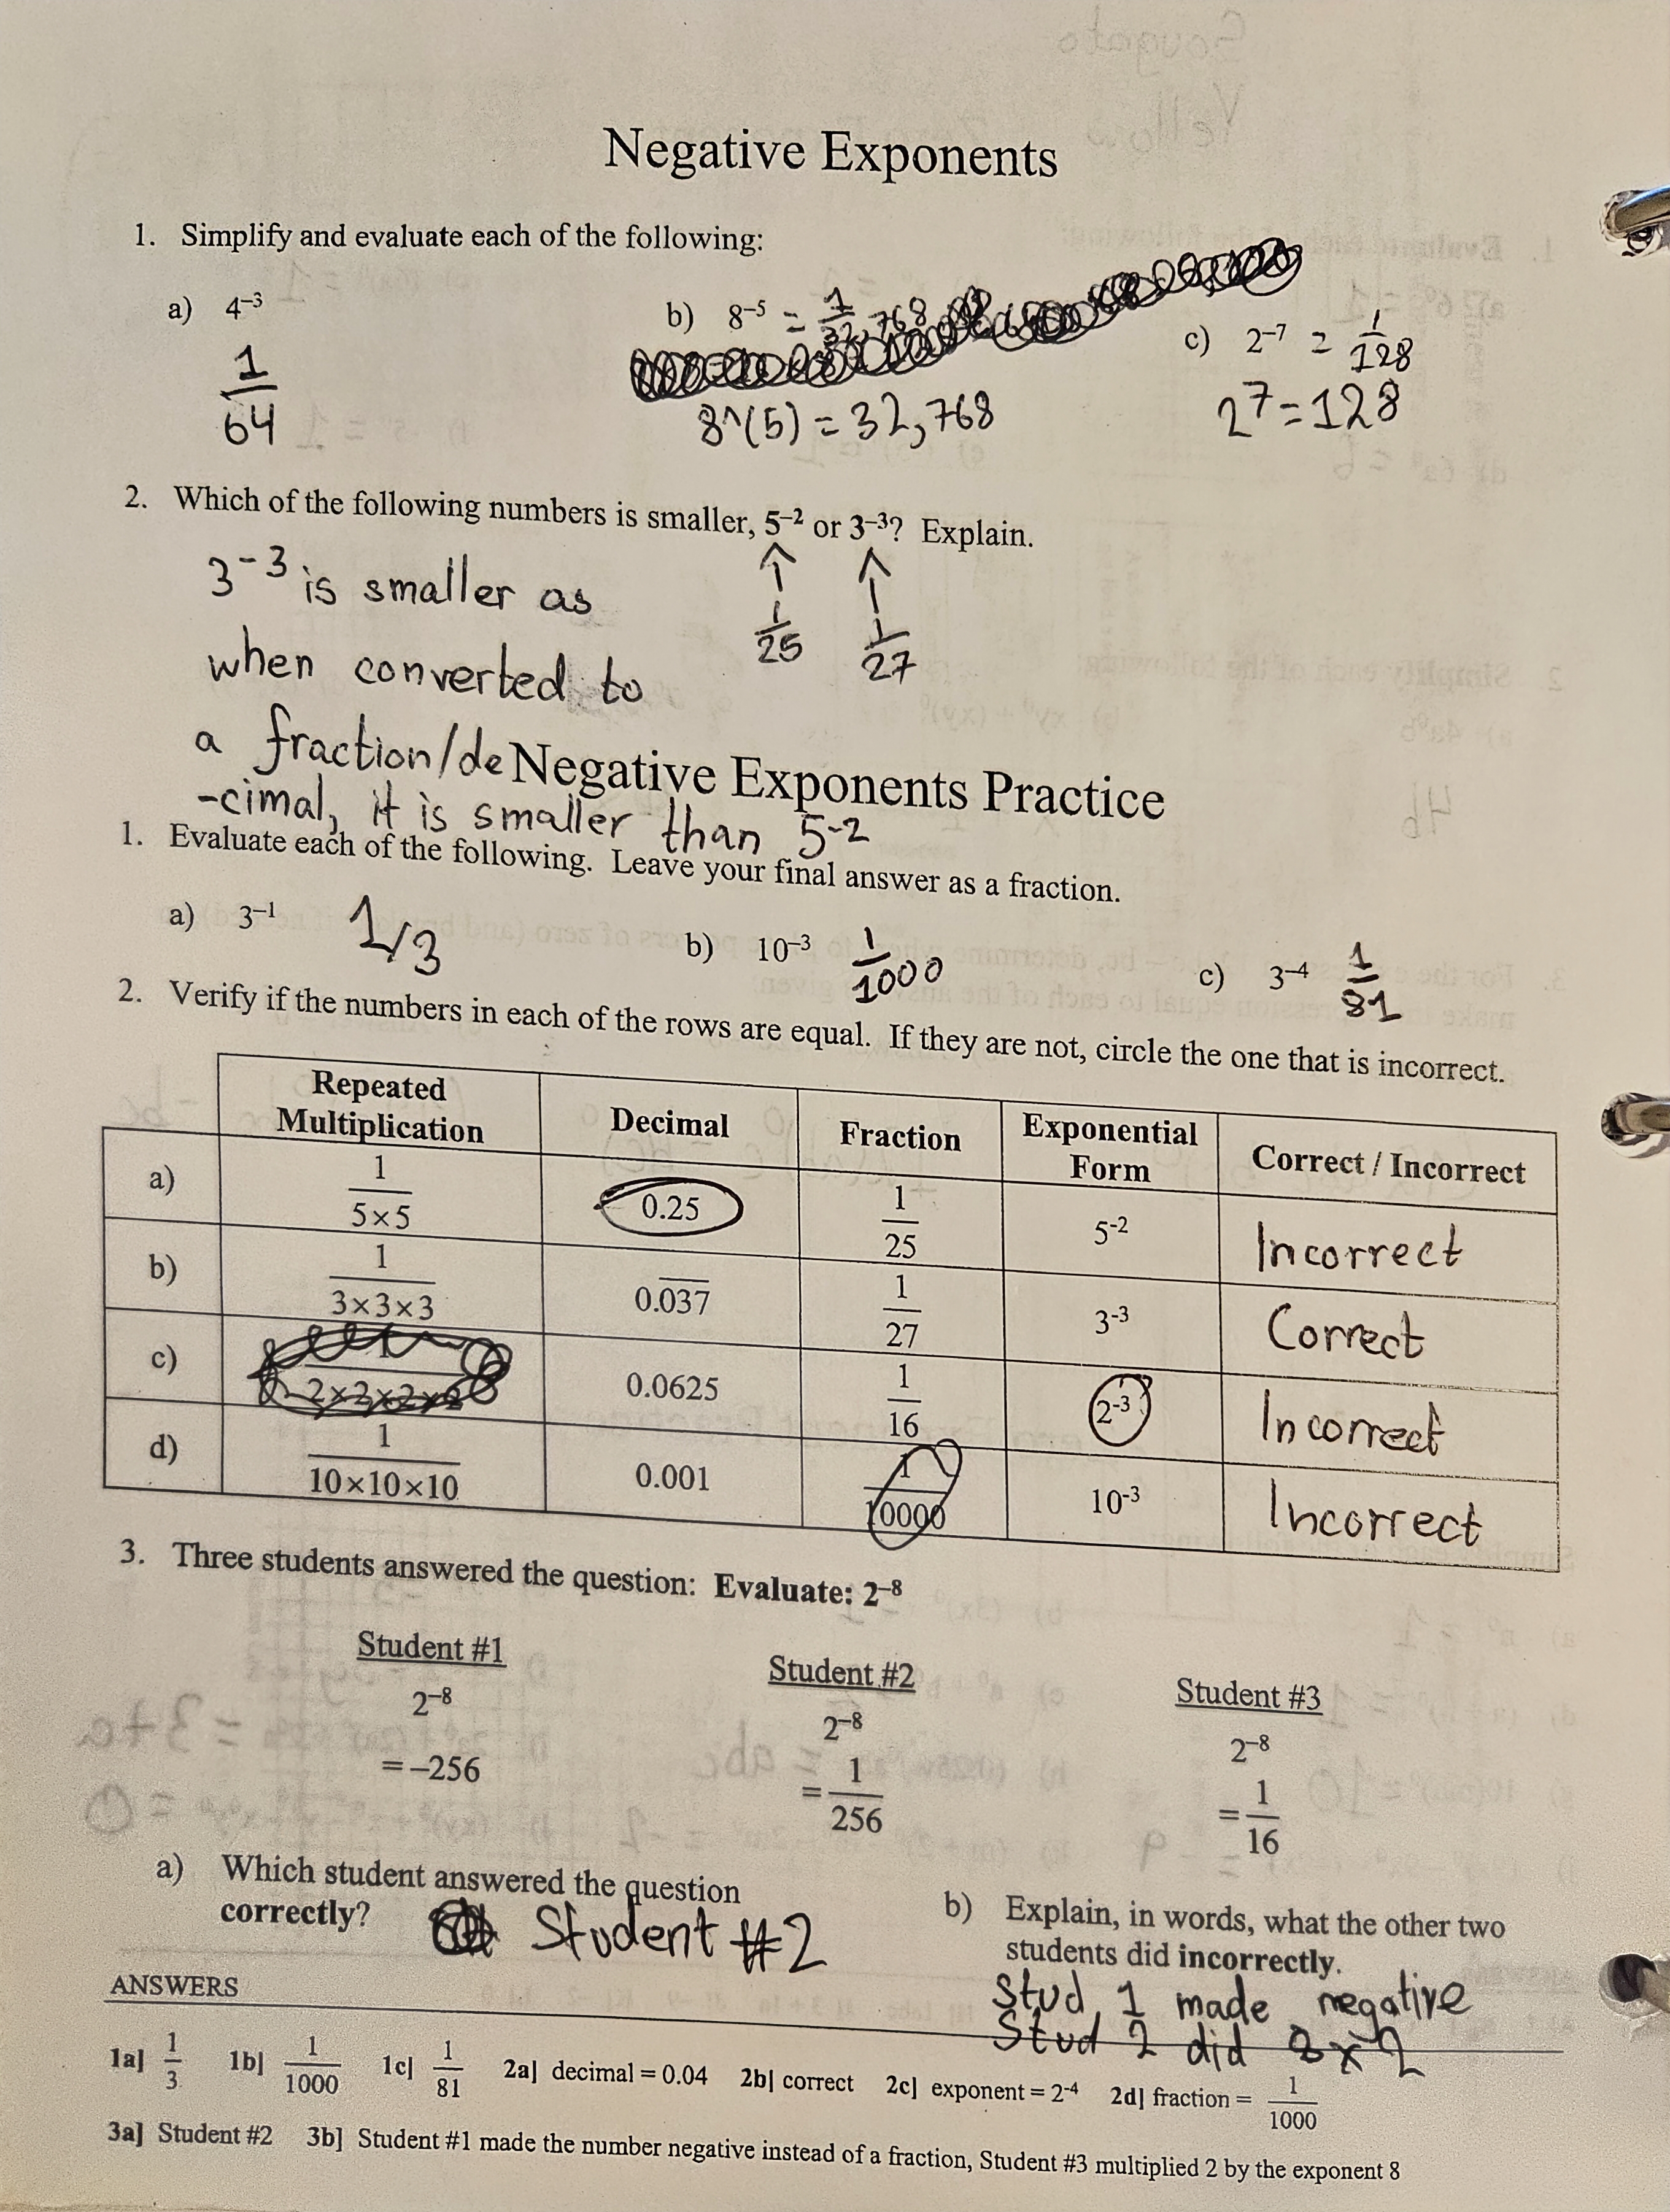
Negative Exponents - in order to solve an expression with a negative exponent, you can convert the value into 1 over the product of the raised number. The second image has examples of me doing so, as well as related questions and tables with negative exponents. This topic allowed us to really break down the meaning of certain exponents and use it to solve raised numbers.
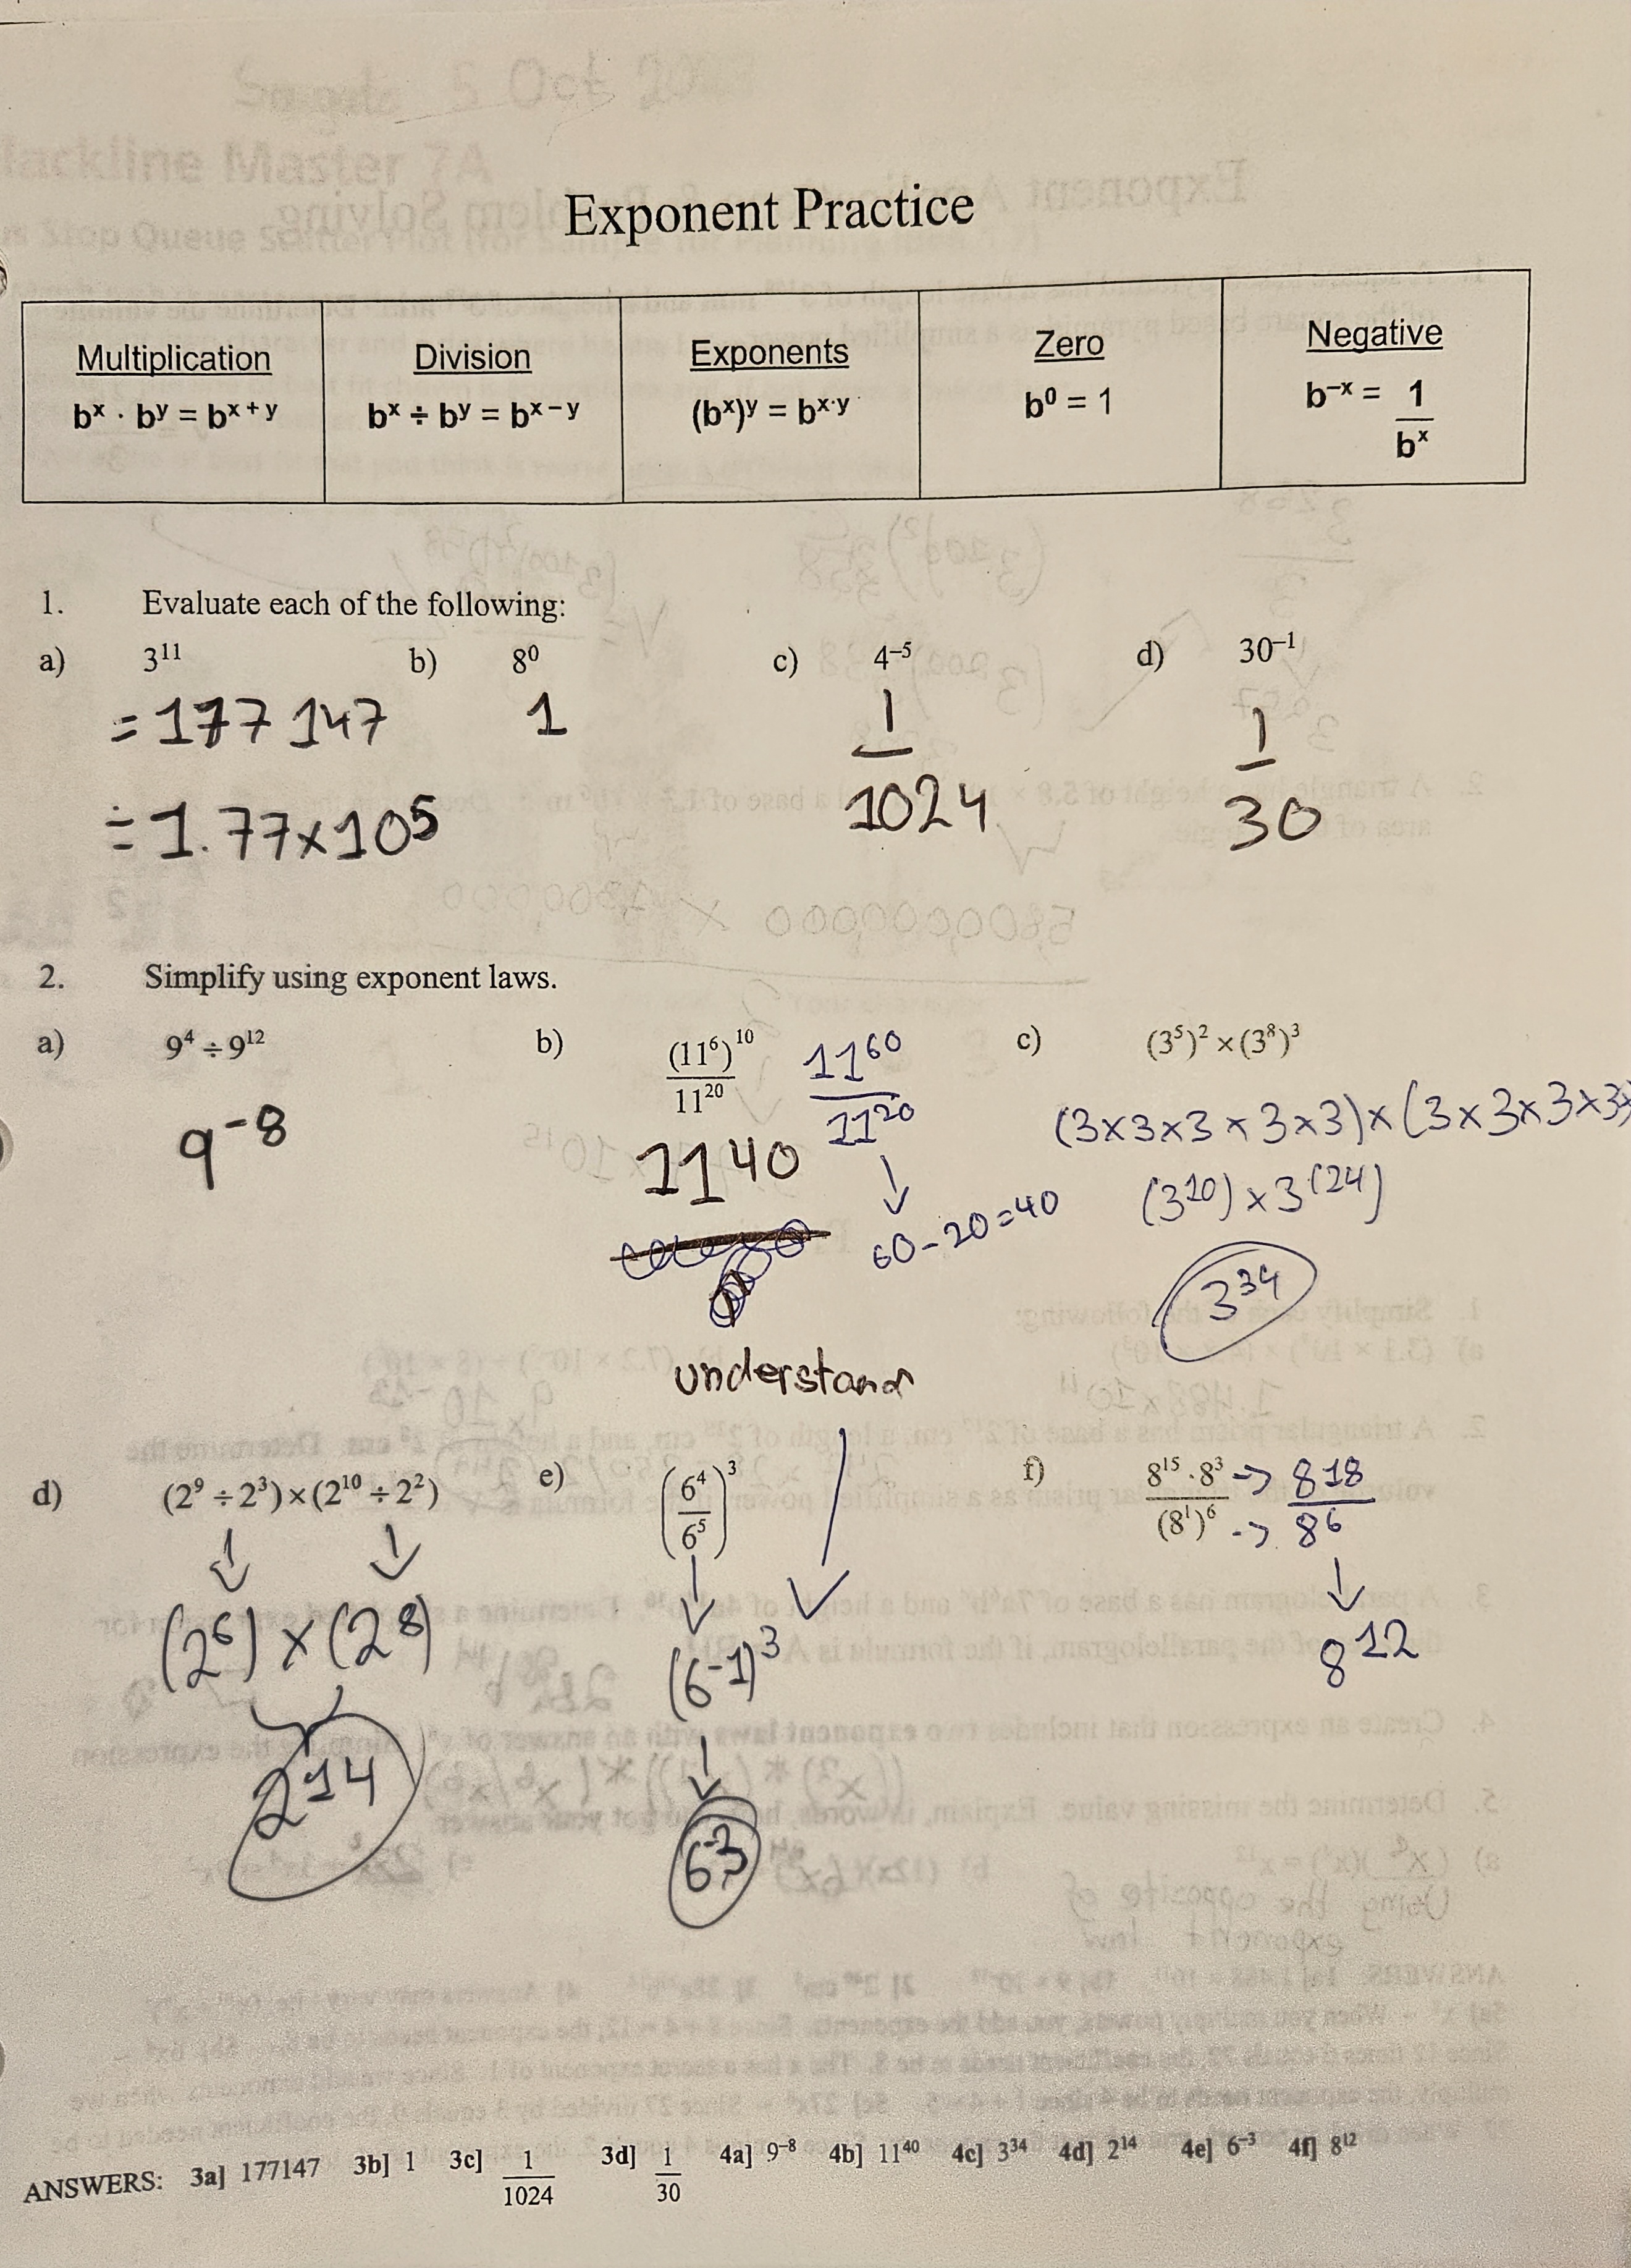
The third image includes all the rules for exponents we have gone over, as well as some questions with them in use. In class we learnt how to identify the type of exponent expression and use the rulesheet attached to solve them. Overall I was able to learn all different types of exponent equations and was able to put them into use with word problems and practice on the final image.
Percentages
Percentages are a simple way of expressing a part of a whole number. They can be converted to other forms, such as decimals and fractions.
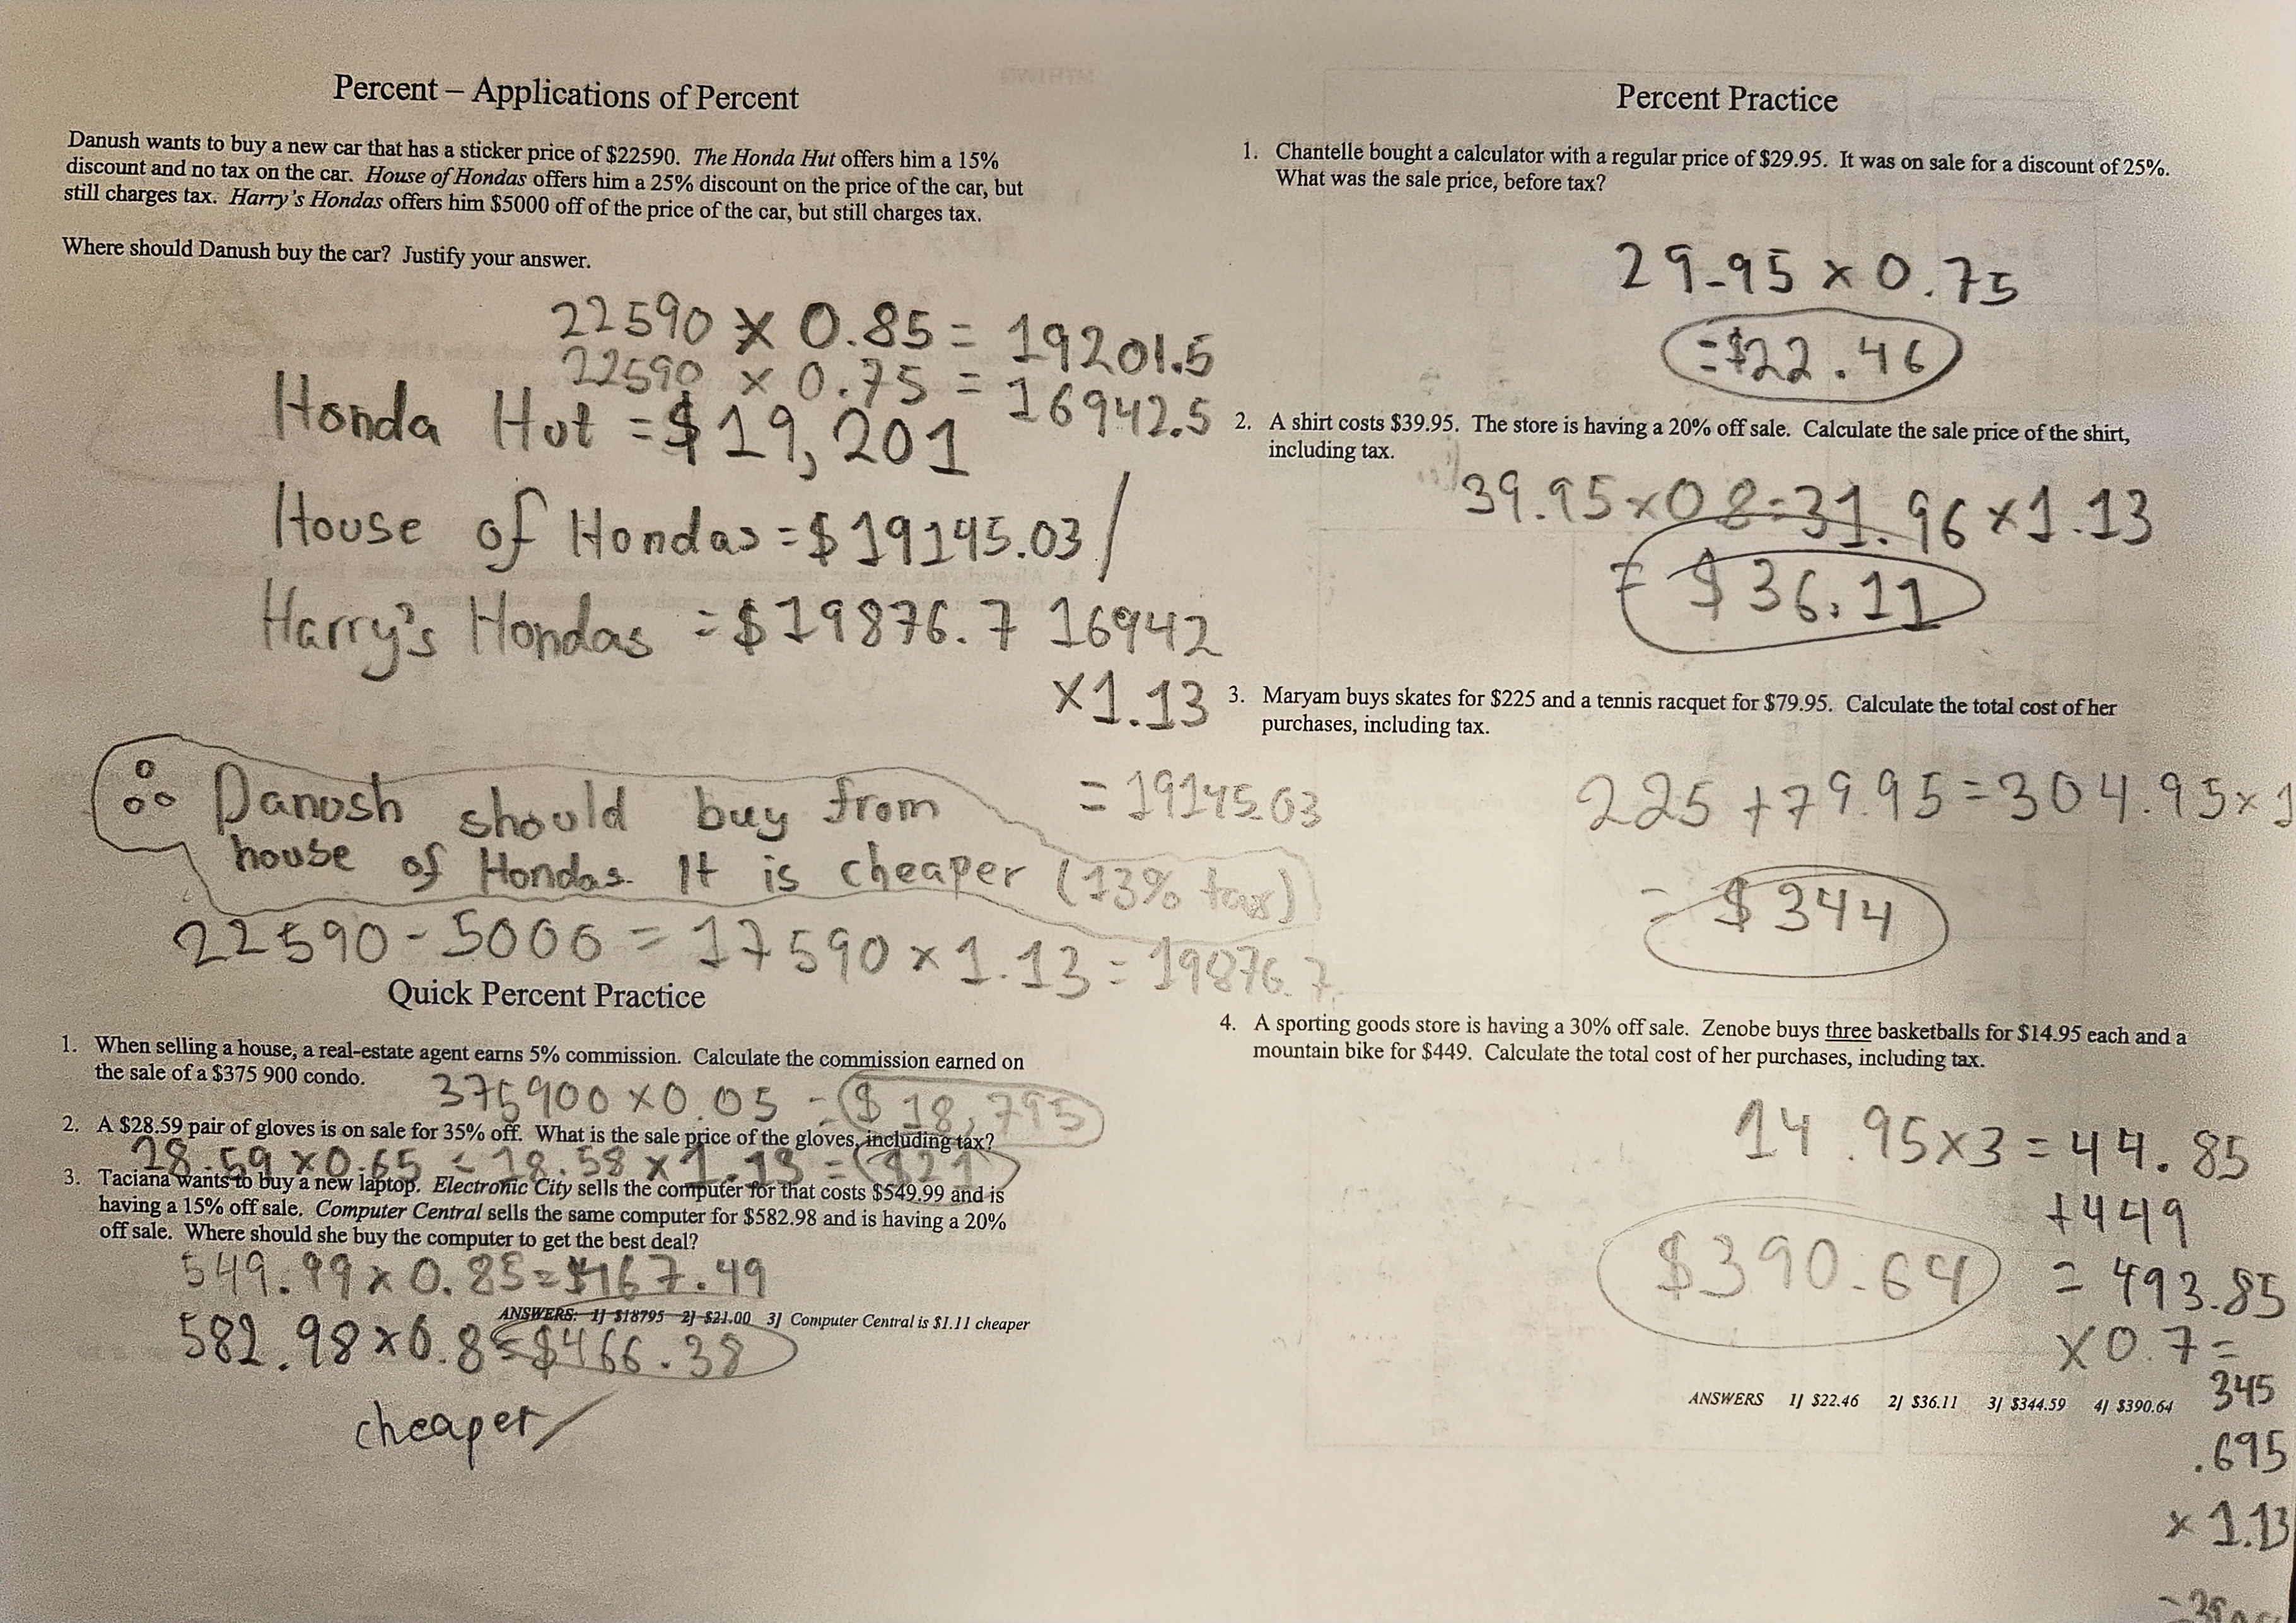
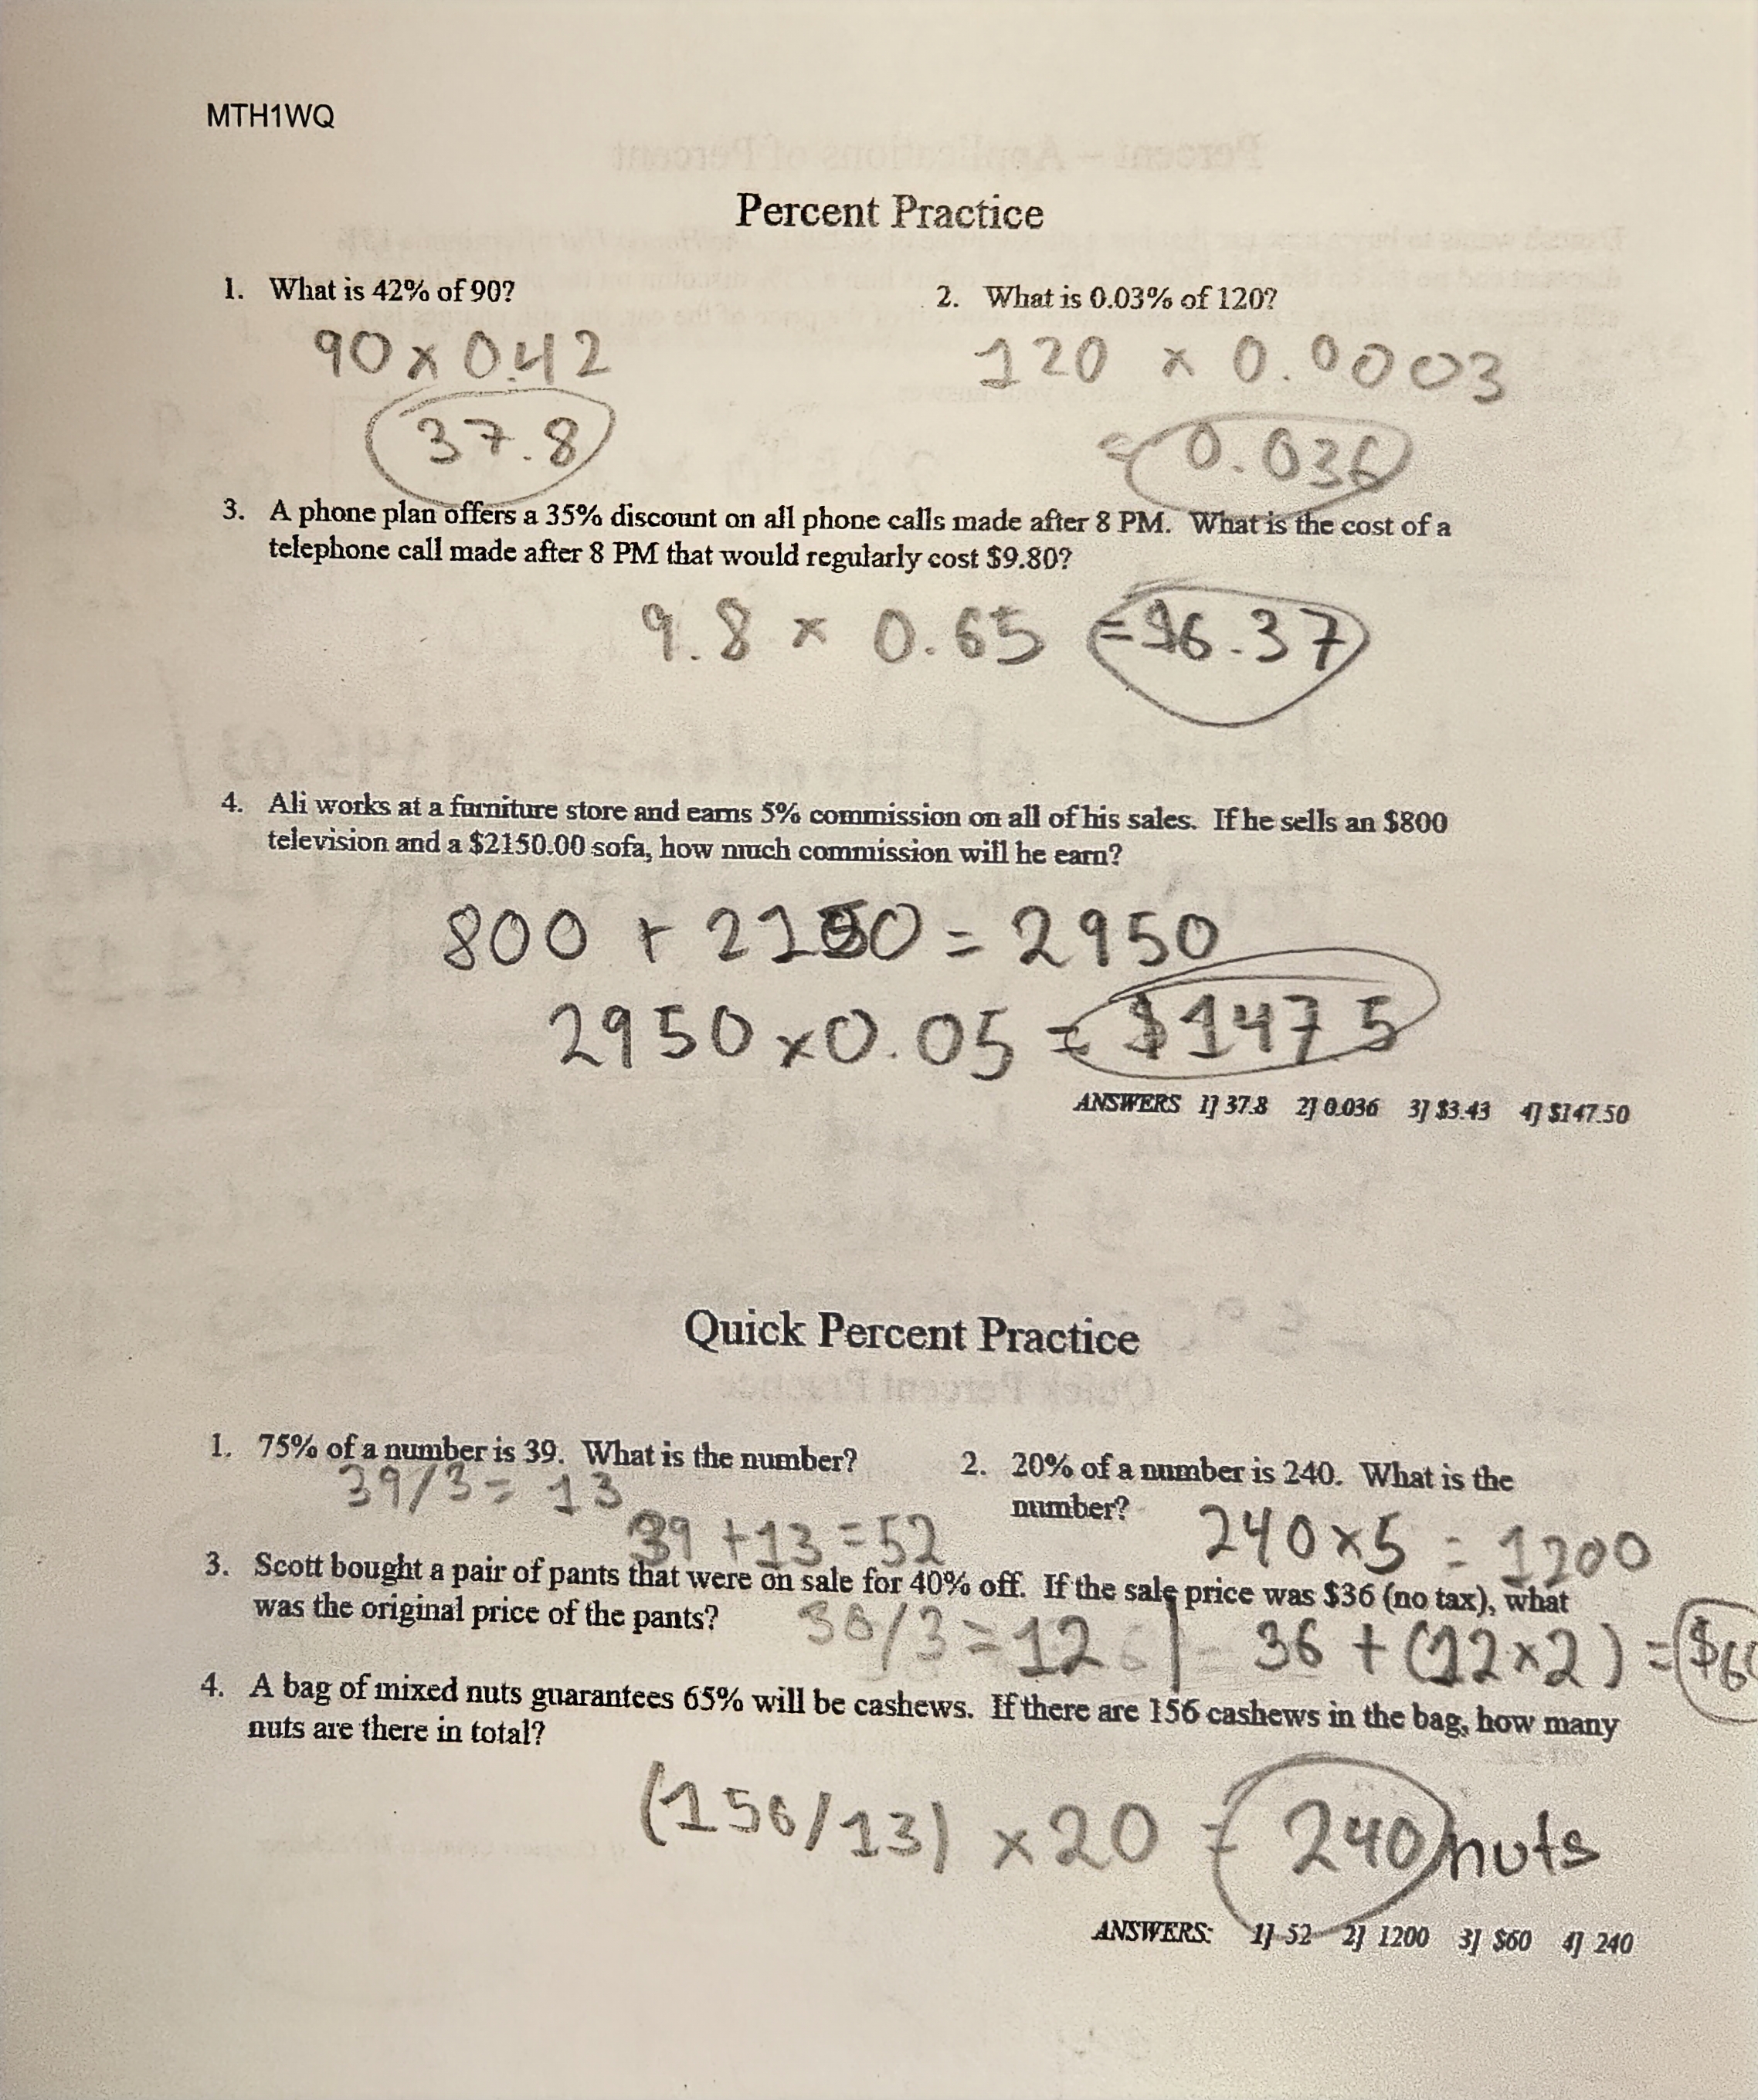
The main method we used in class to solve percent problems is to convert percentages to decimals. This is done by simply taking the percentage and putting it behind a decimal point, e.g. 75% = 0.75. After converting the percentage, it allows us to have an easier value to work with, where we can simply multiply the decimal by a number to find the answer. In this case, we'd multiply 0.75 by the number we want to find 75% of. The images attached contain examples of this learning in use.
Ratios
Ratios are similar to fractions, but also act as a rate for something. E.g. every 2 children in the room, there are 4 adults (2:4).
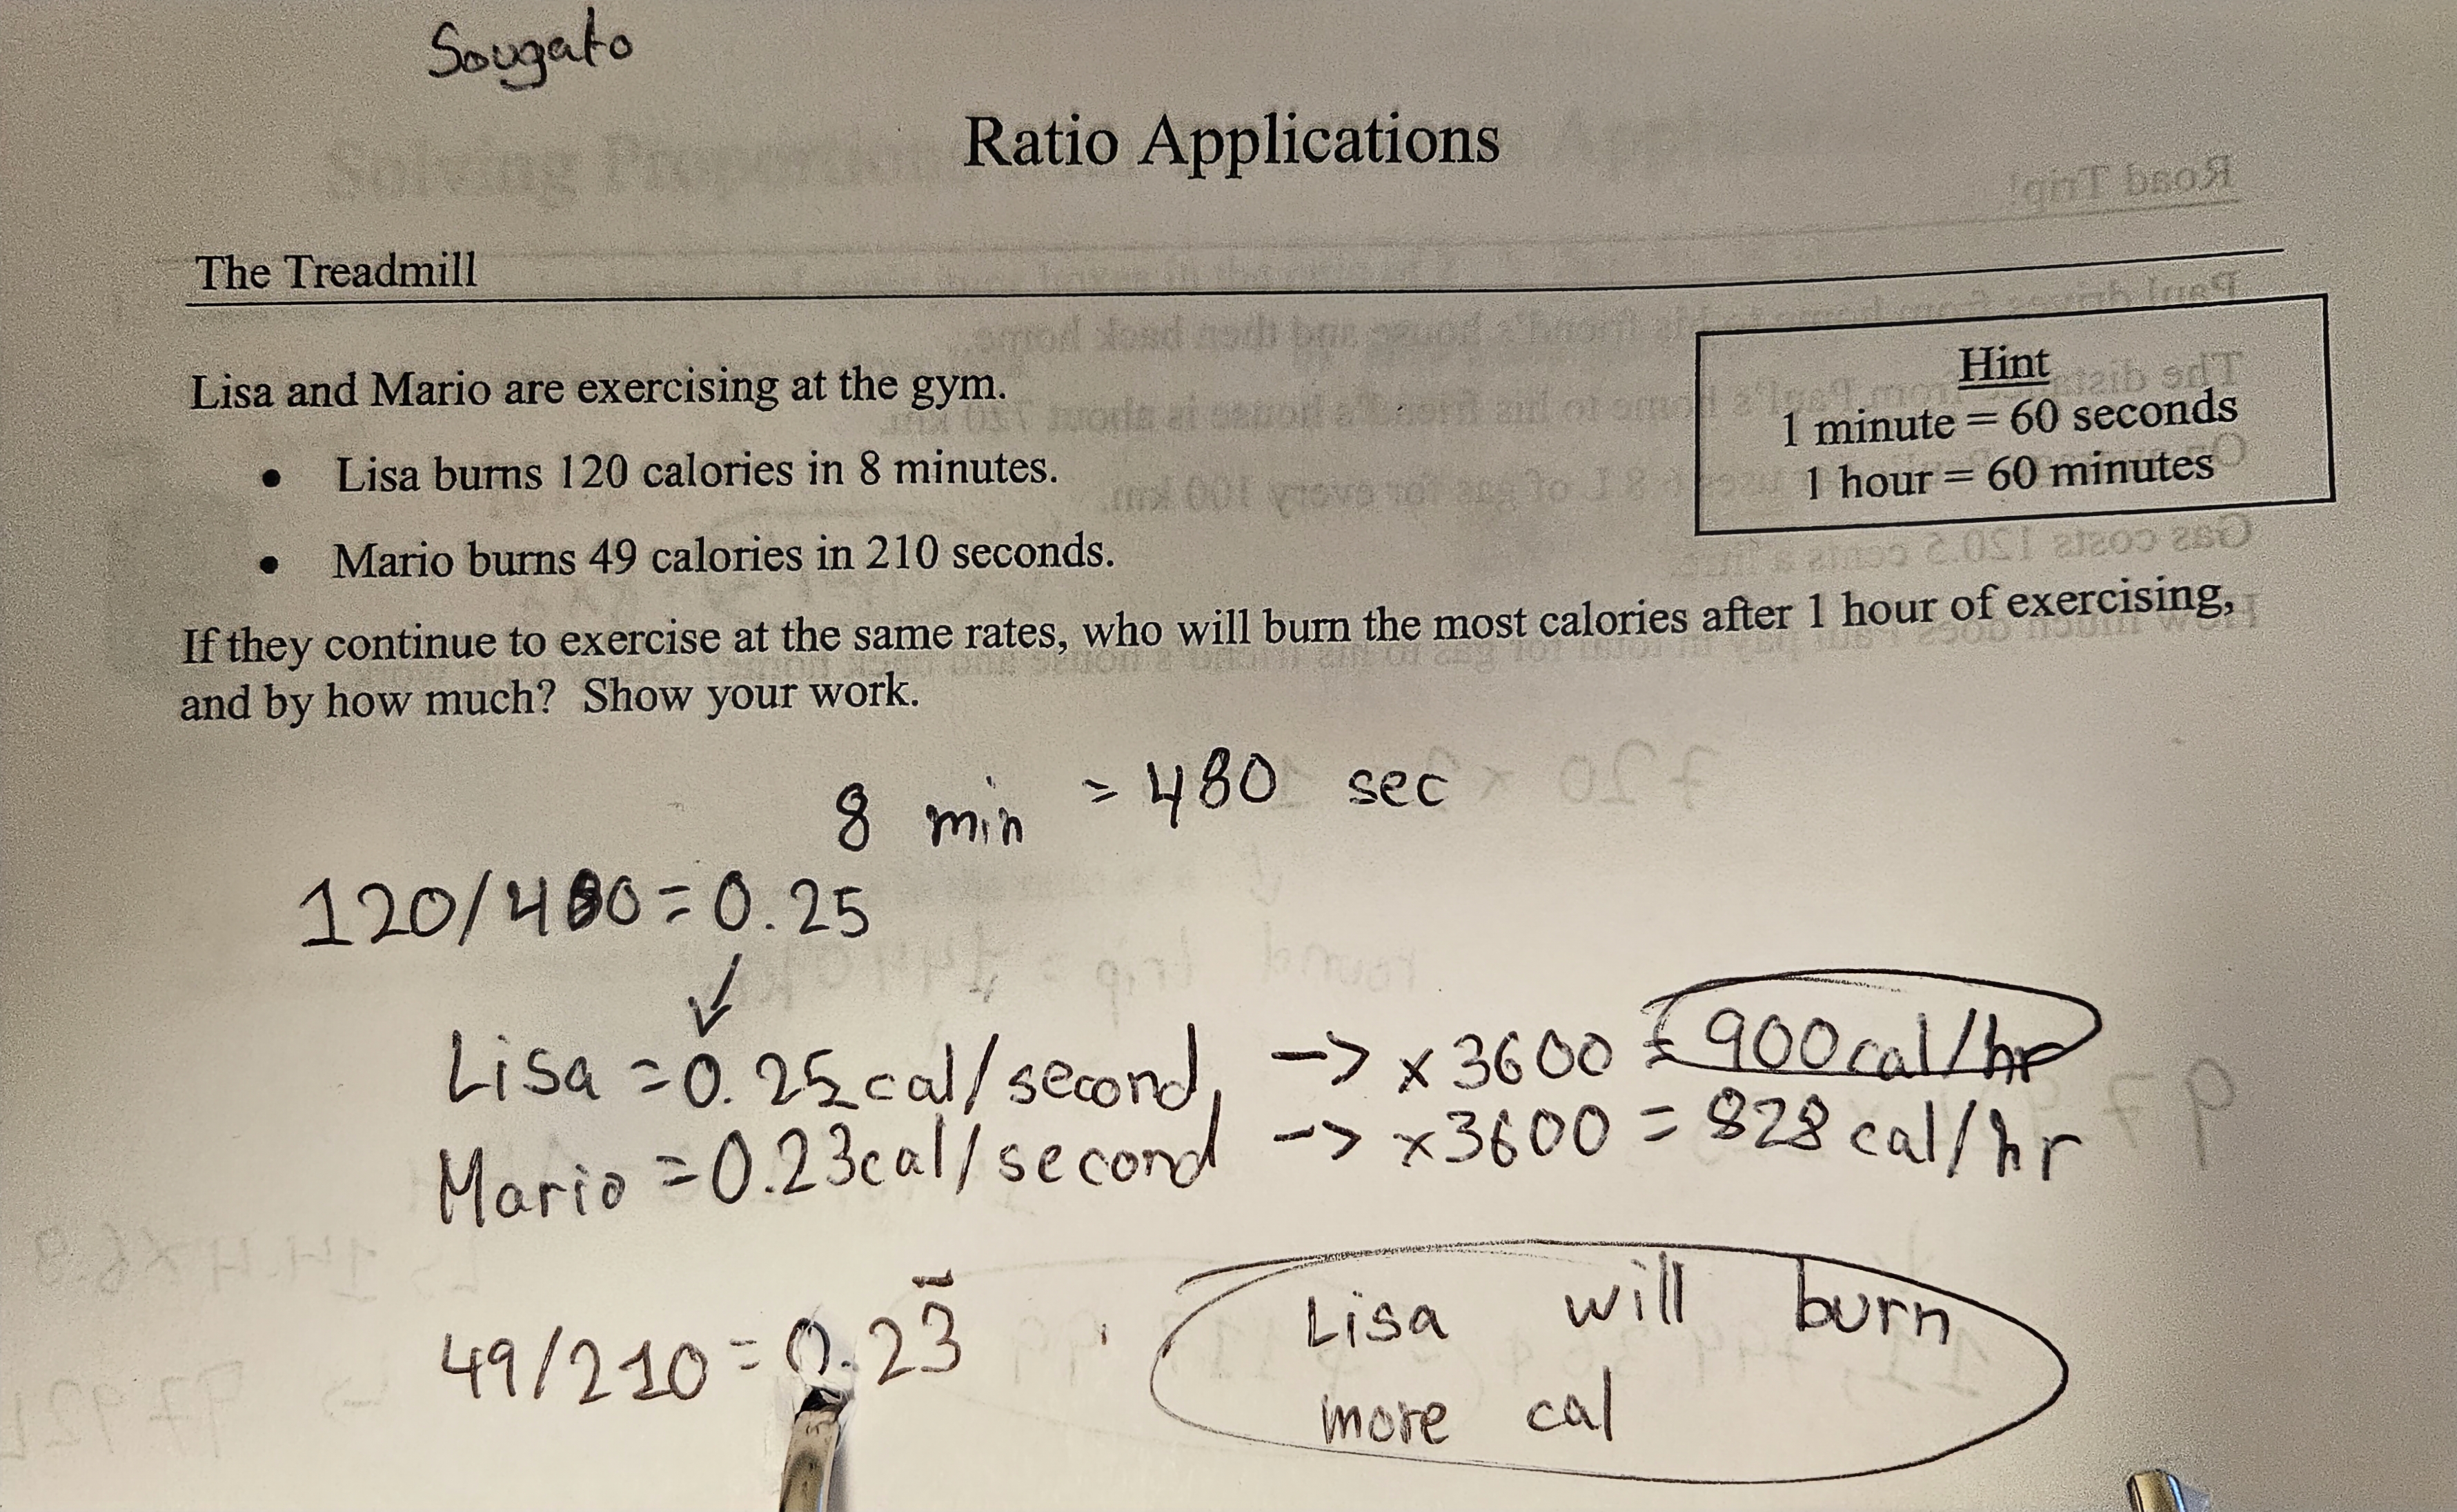
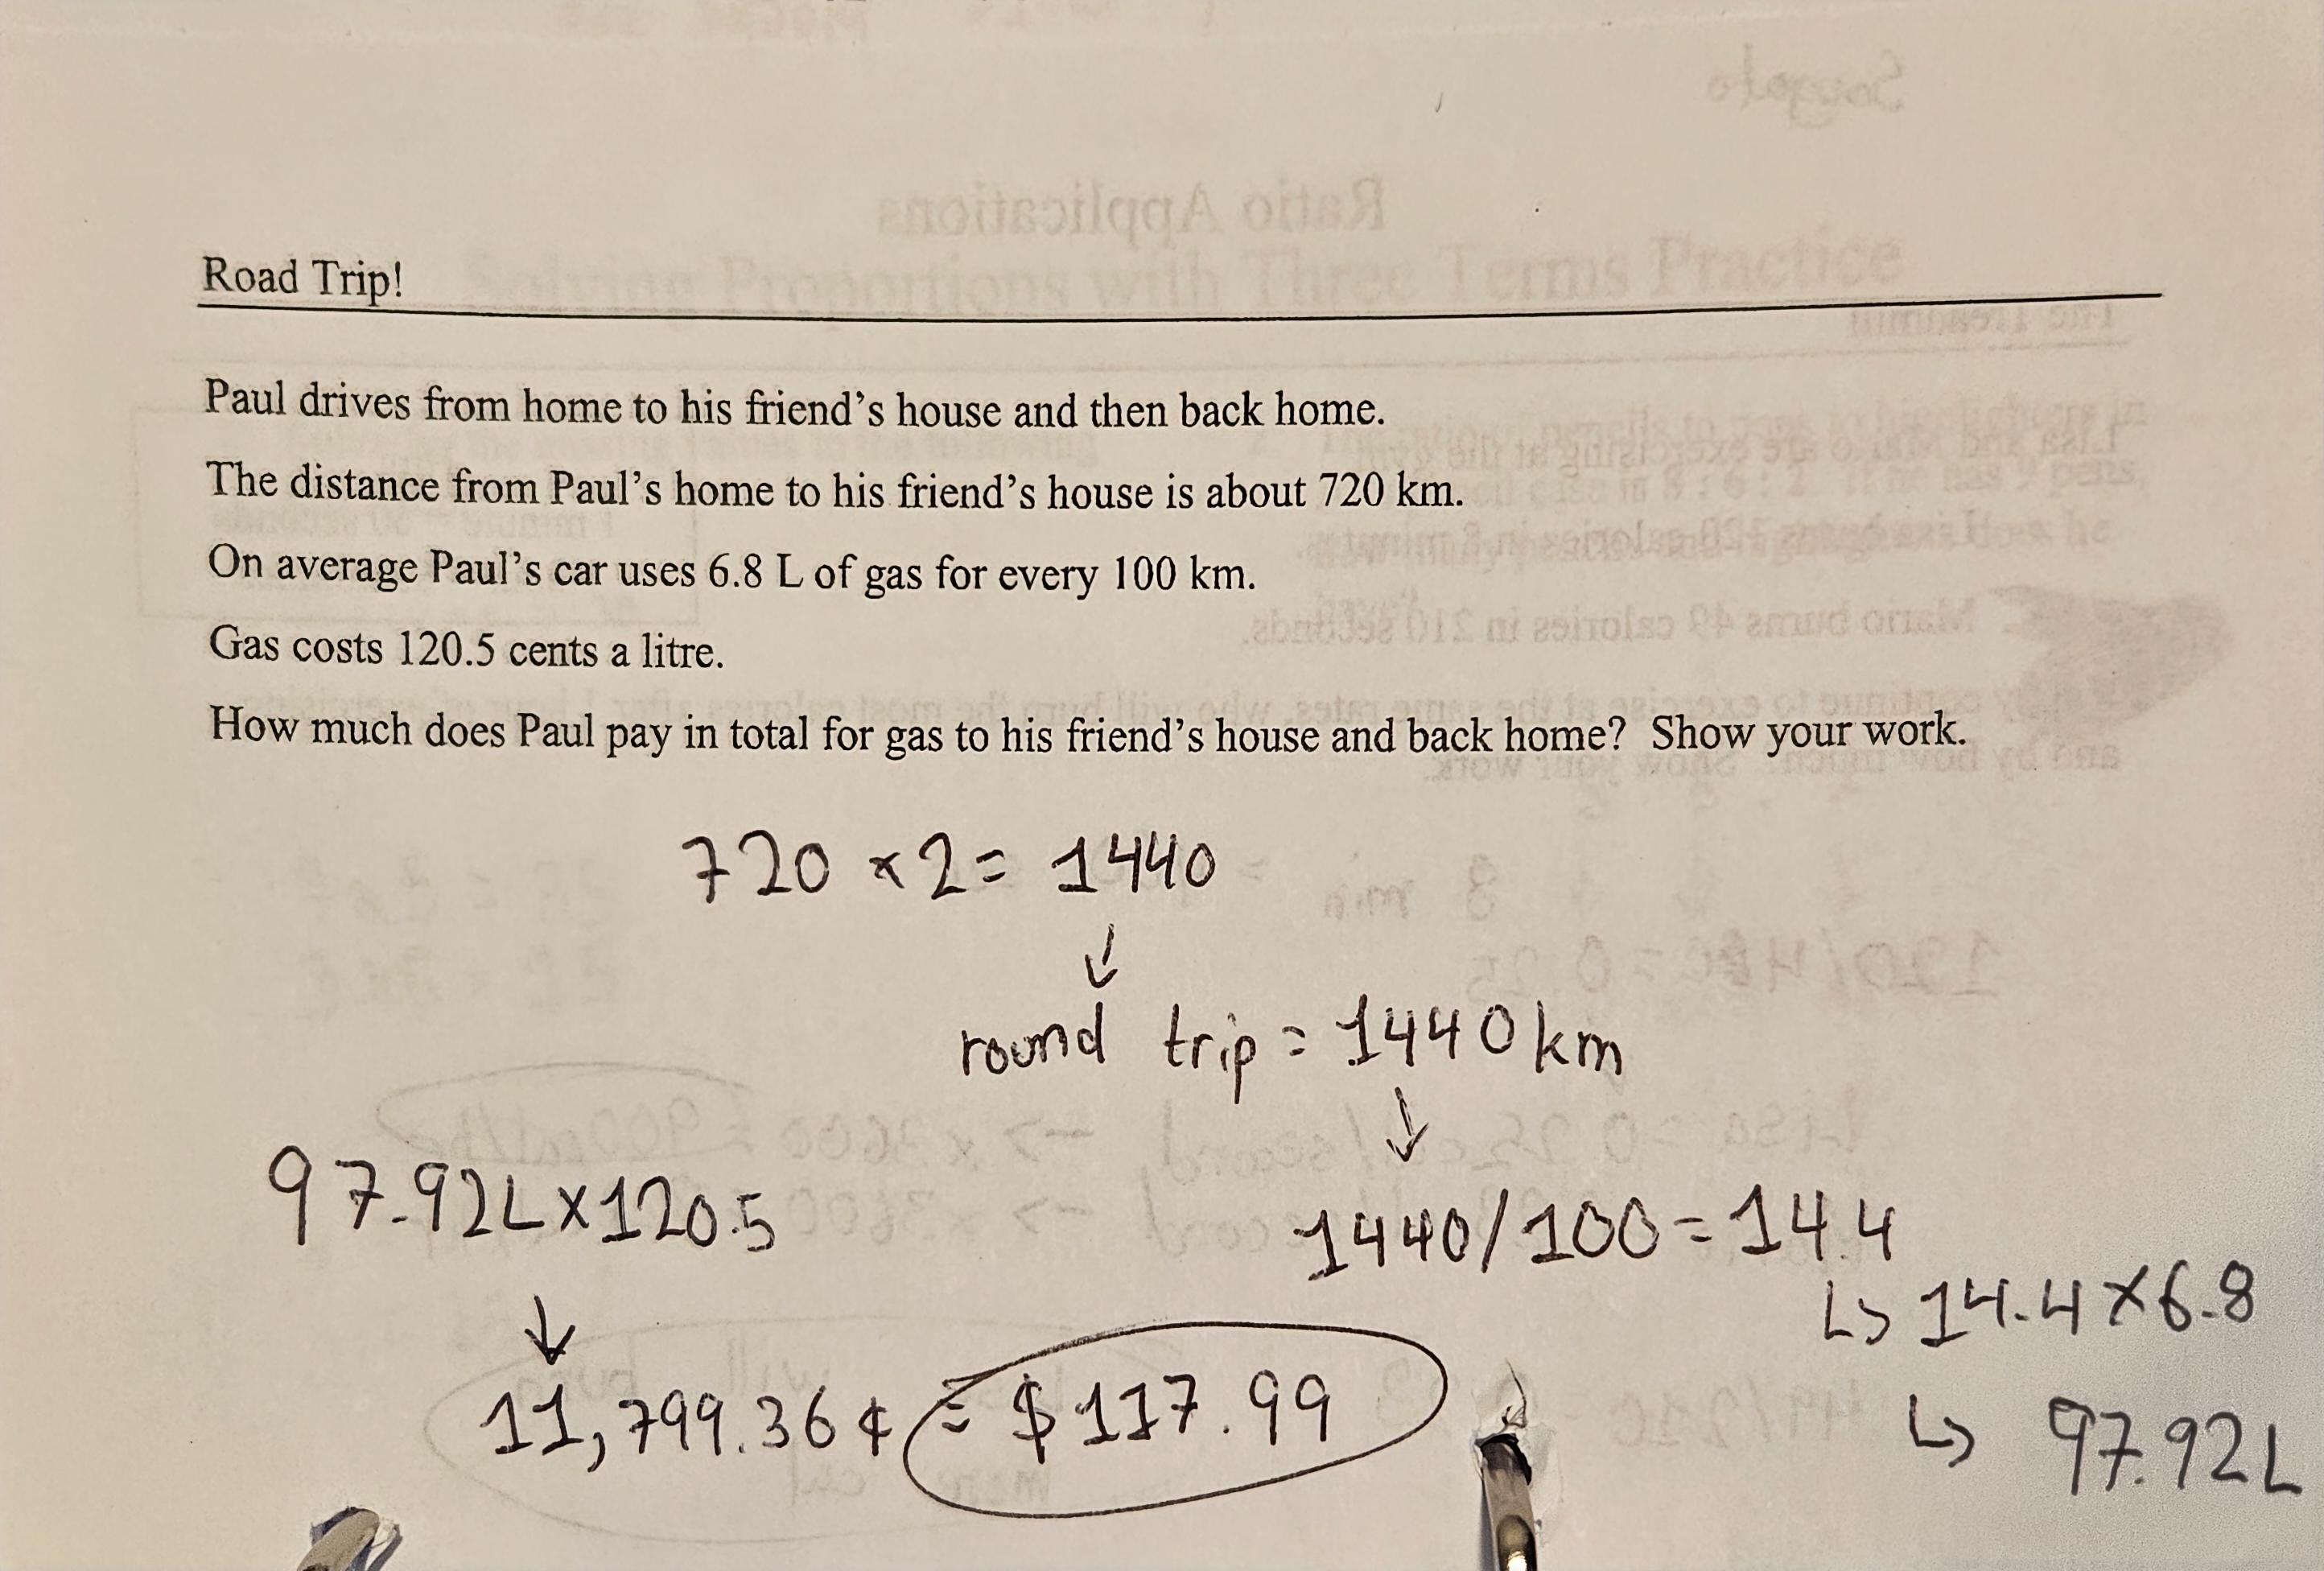
The above images contain some examples of ratios used in real life. An example from the first page is Lisa burning 120 calories in 8 minutes. If we convert this into a ratio/rate we get 8:120 signifying that every 8 minutes passed, Lisa will burn 120 calories. The same can be done for Mario in this example to be able to compare the calories burnt of both athletes. Ratios may also be used as rates. The second image gives us an idea of how we can use ratios in real life, an example being gas prices by the litre.
Rates
The main focus on rates was on unit rates, this may be the cost of one item in a bundle for example. In class, we have gone over multiple worksheets to solve for unit rates. Unit rates can also be expressed as a ratio of sort, and can be used to find cost of more items, etc.
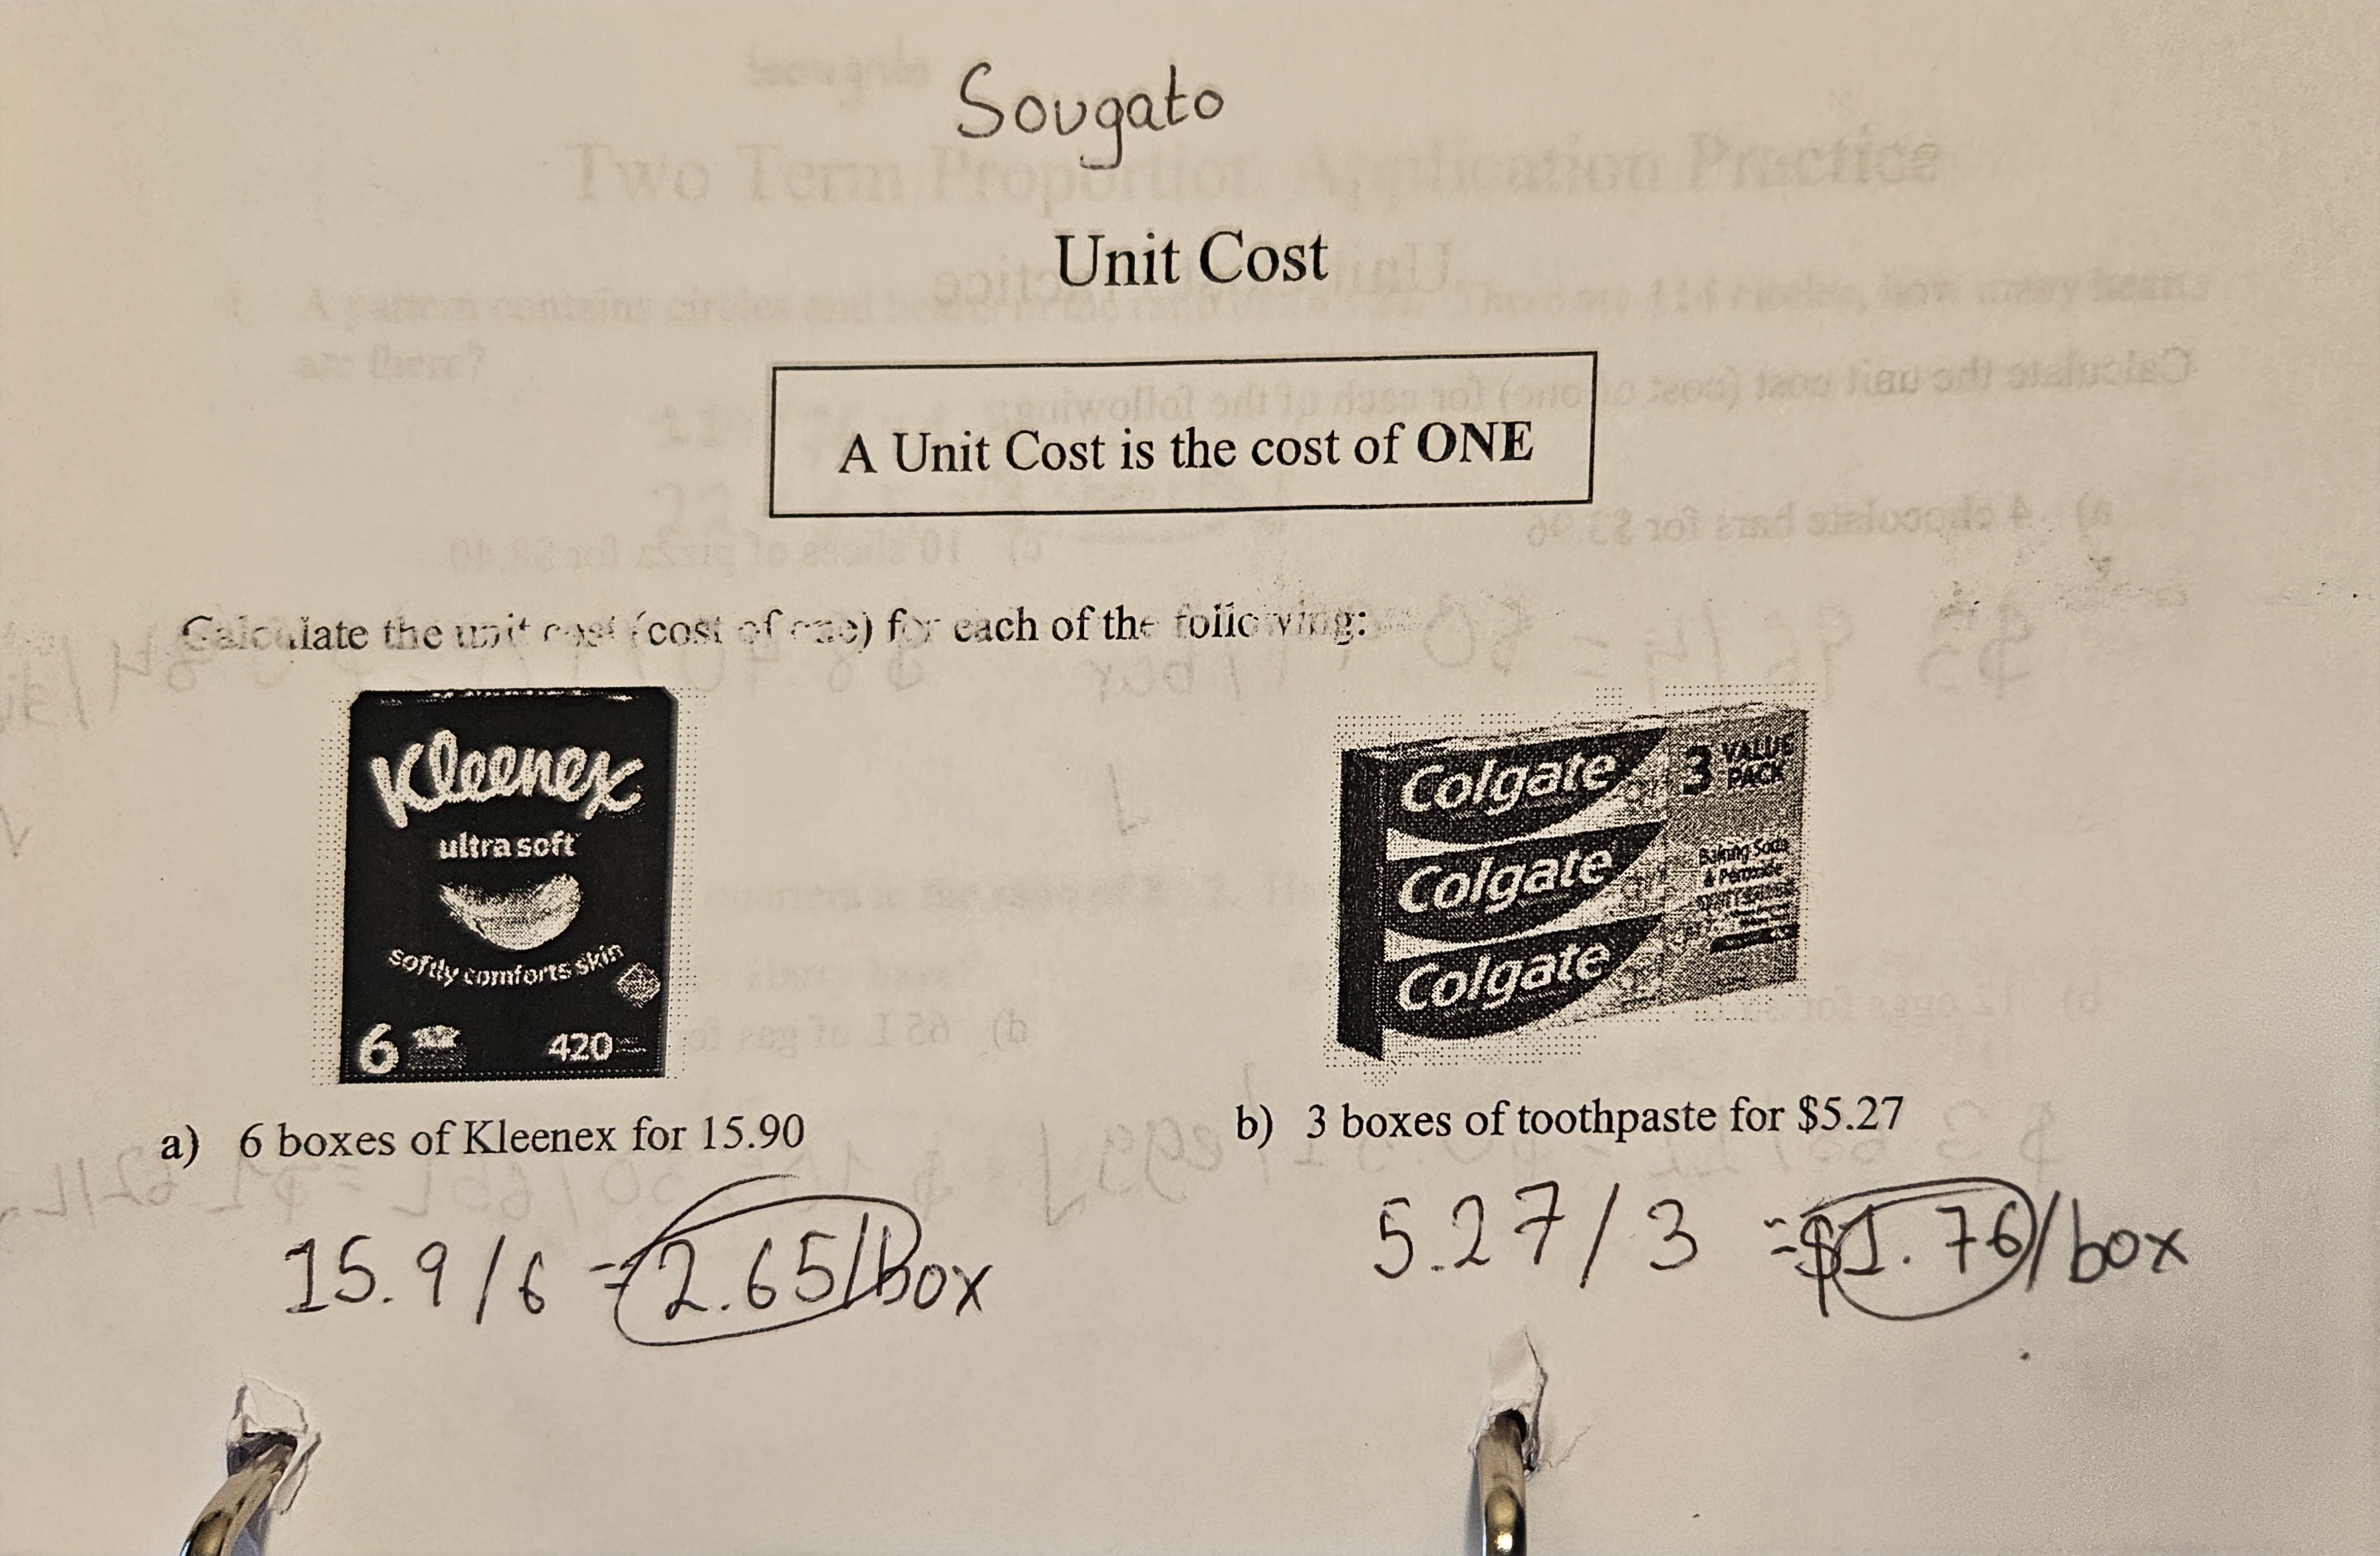
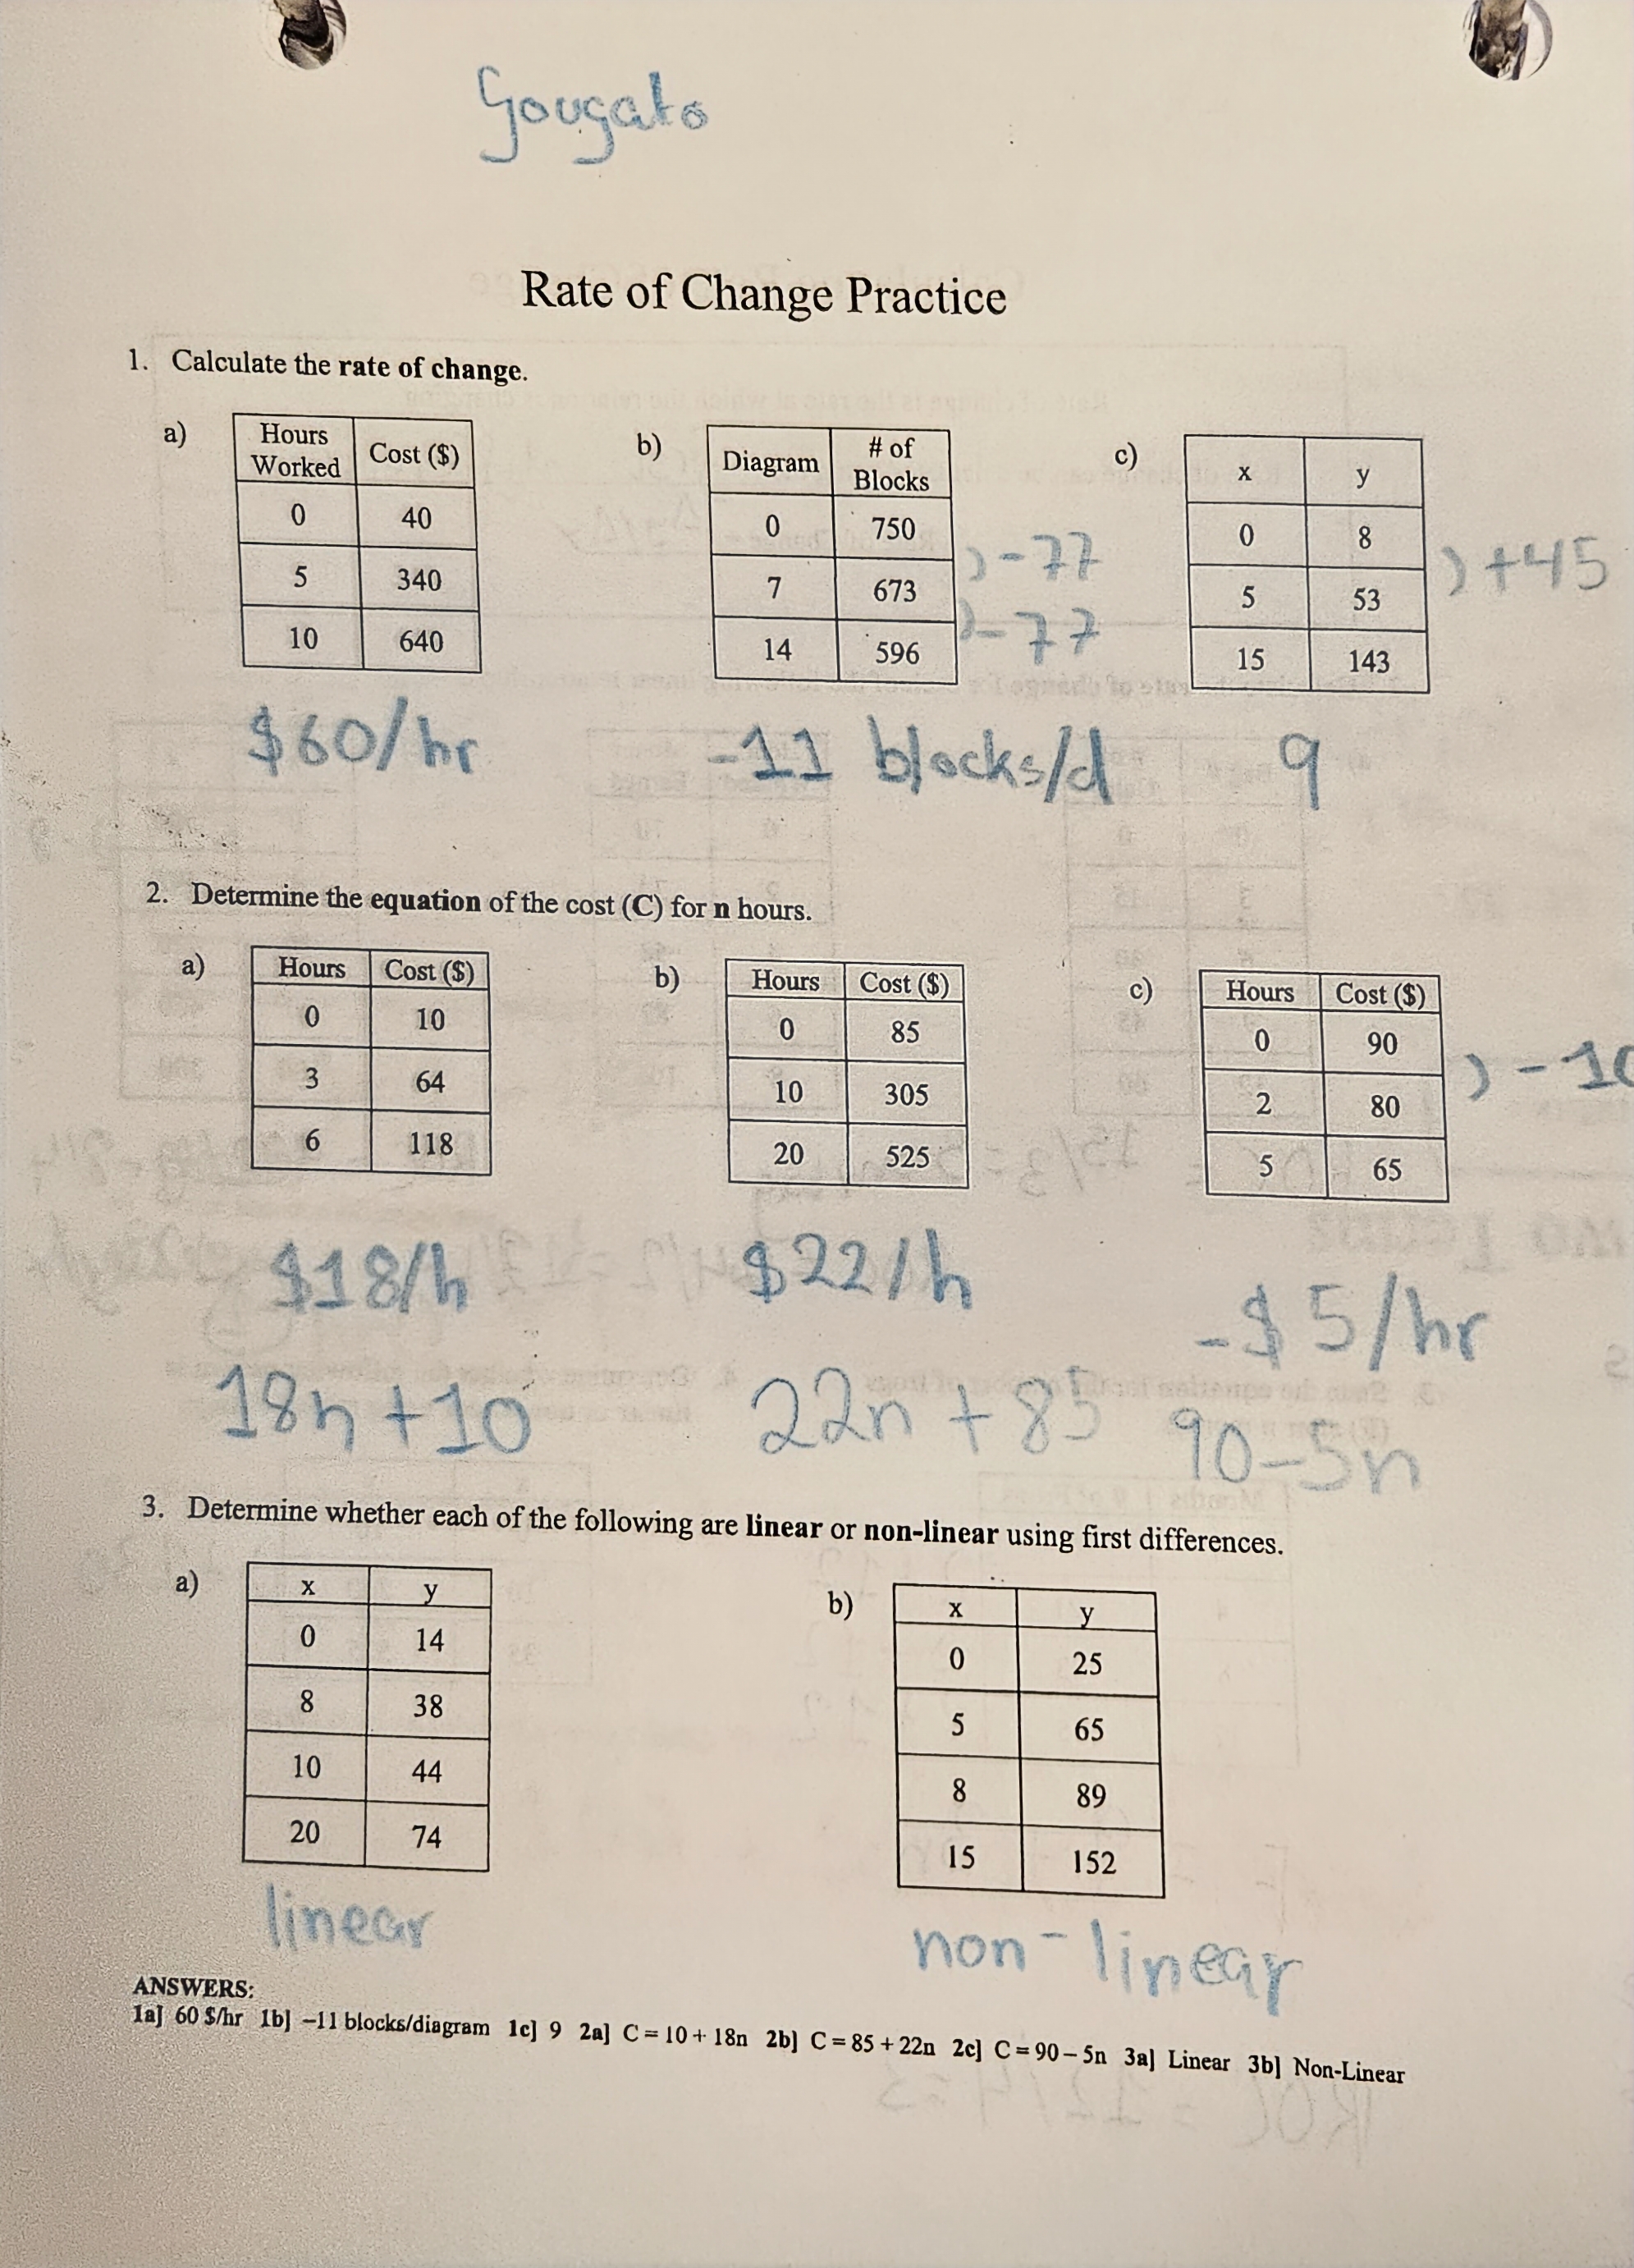
Unit rates are fairly simple to solve. In the first image, we have an example with 6 boxes of Kleenex for $15.90. In order to find the unit rate, we need to find the cost of one box. To do this, we multiply the price by the amount of boxes, in this case 15.9/6, leaving us with the answer of $2.65/box.
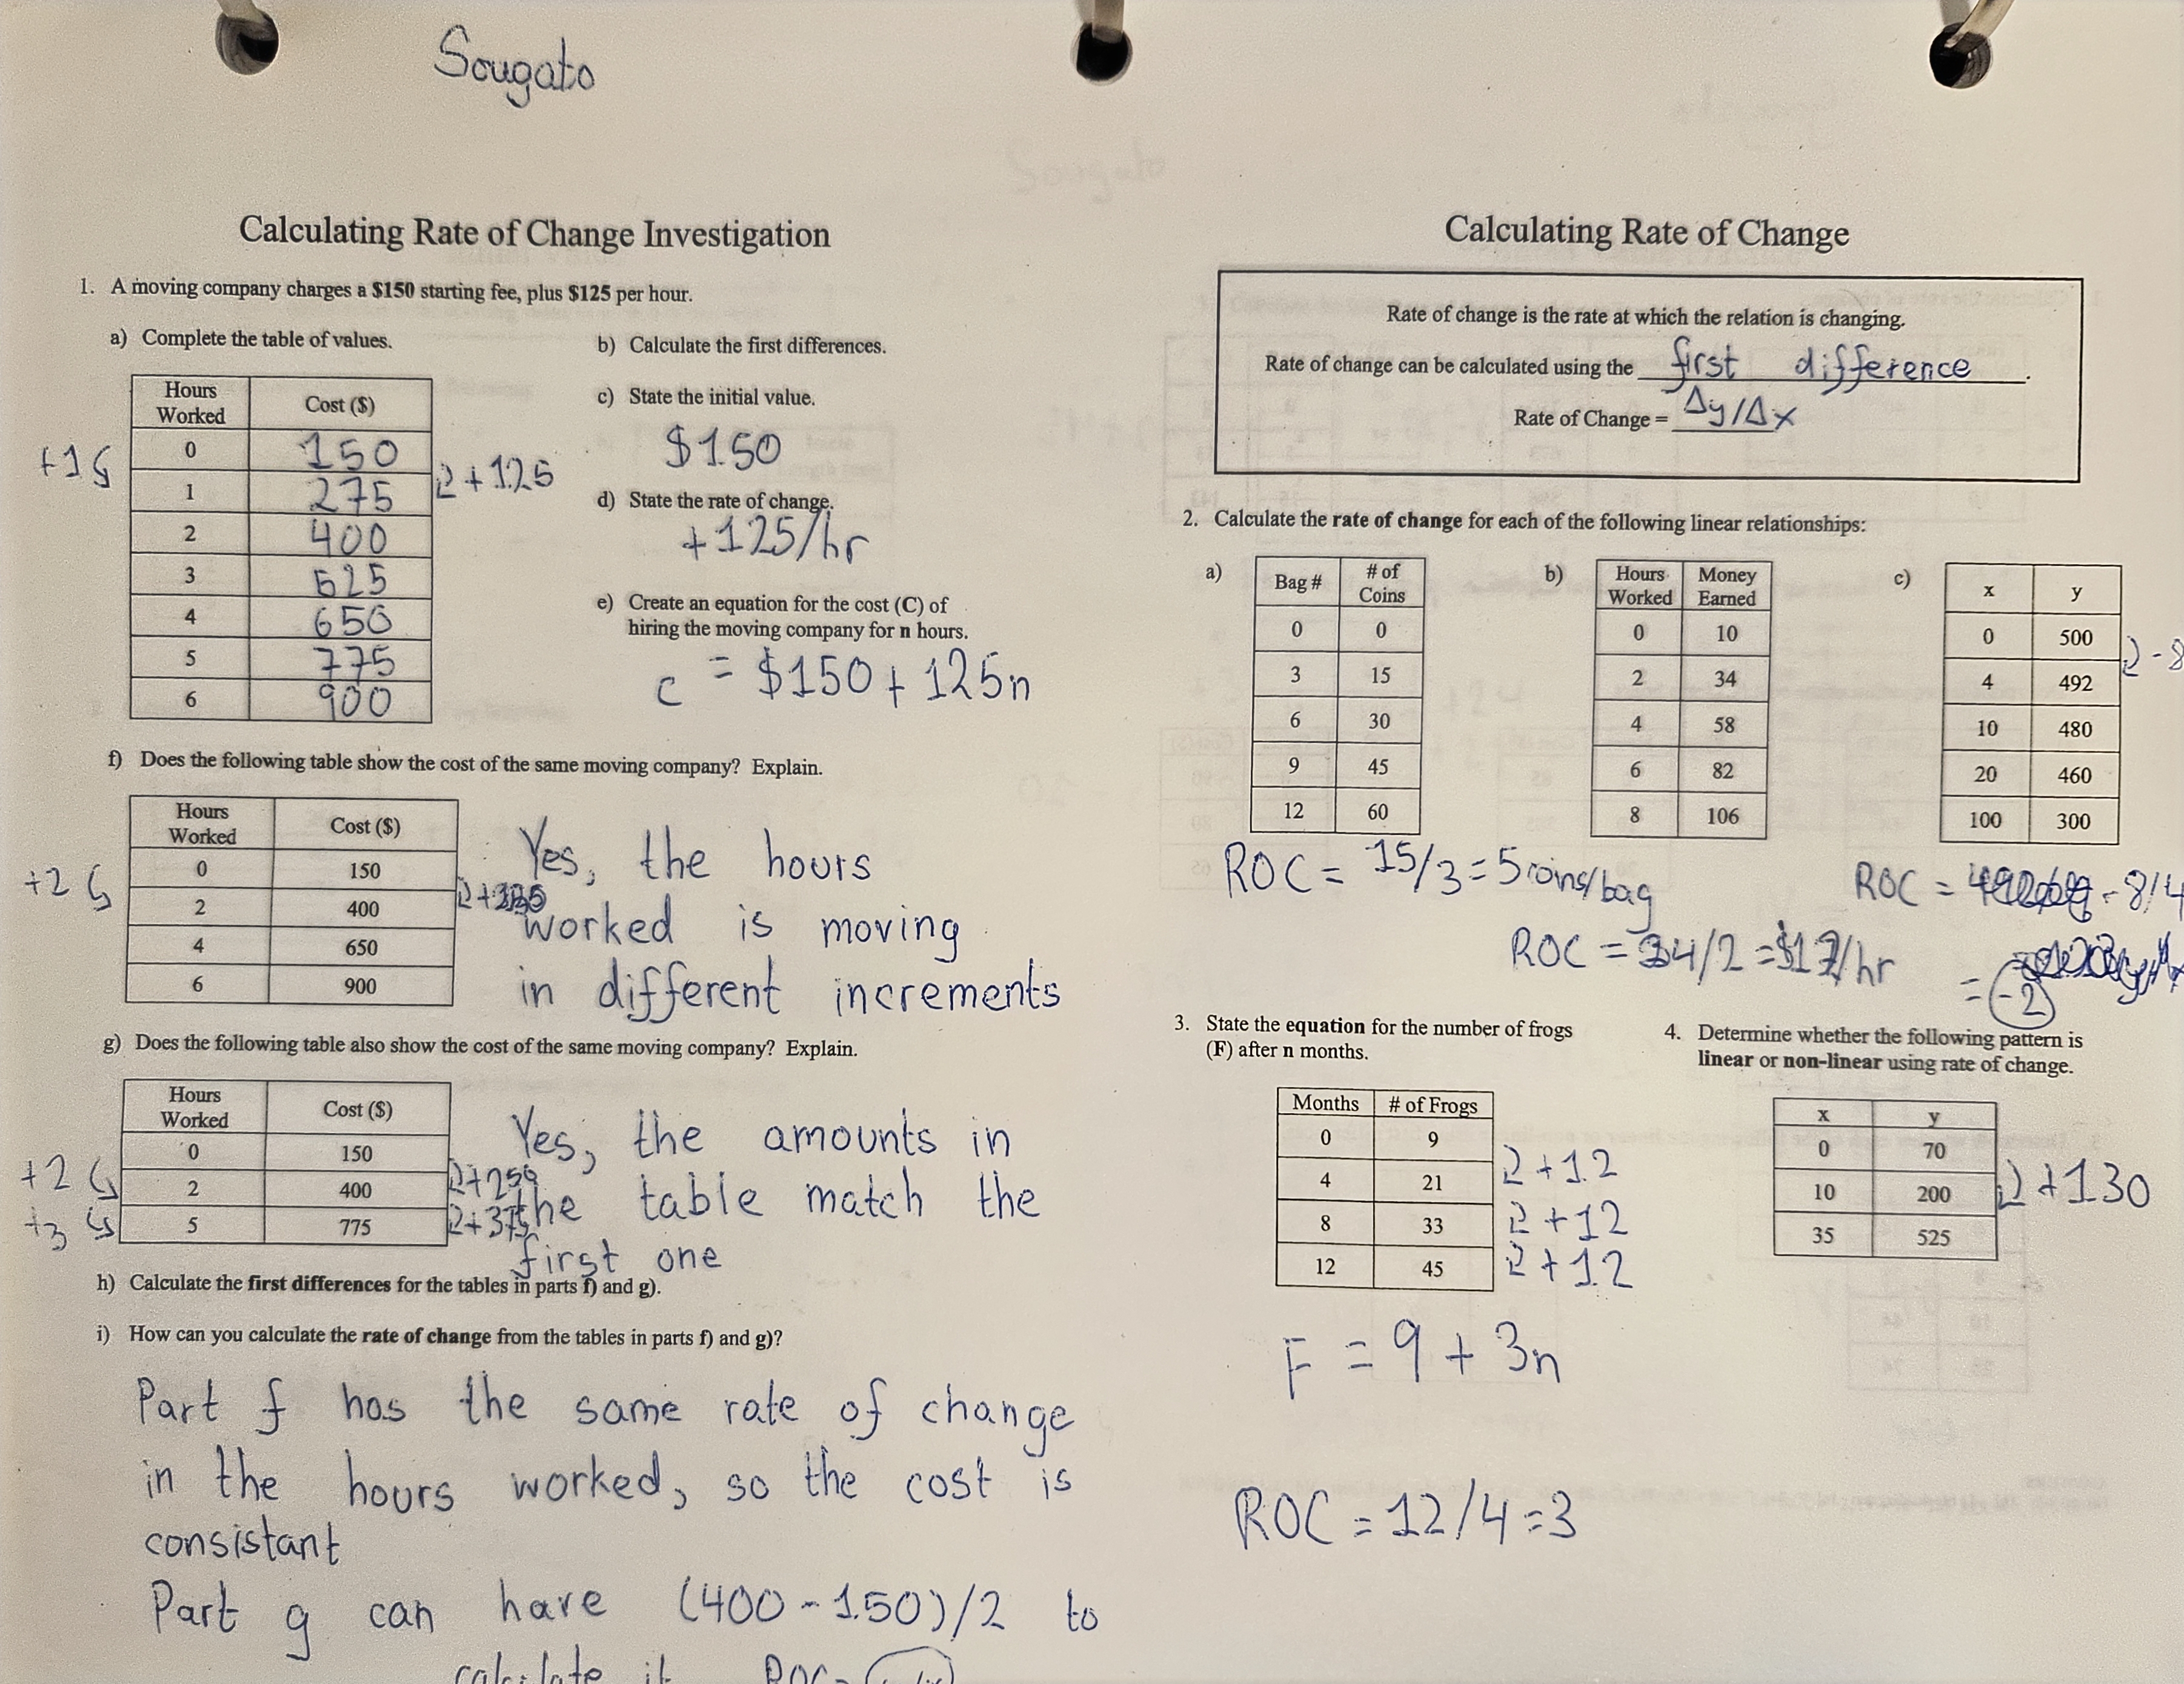
When it comes to finding unit rates in tables, the method to use is to find the difference between each value, e.g. if x = 1, and y = 2 and then x turns into 2 and y turns into 4, we will know that the unit rate is 2x.
Proportions
This topic requires knowledge of ratios, as it is an expansion on that topic. Solving proportion questions are essentially converting multiple ratios into one that can be used to compare.
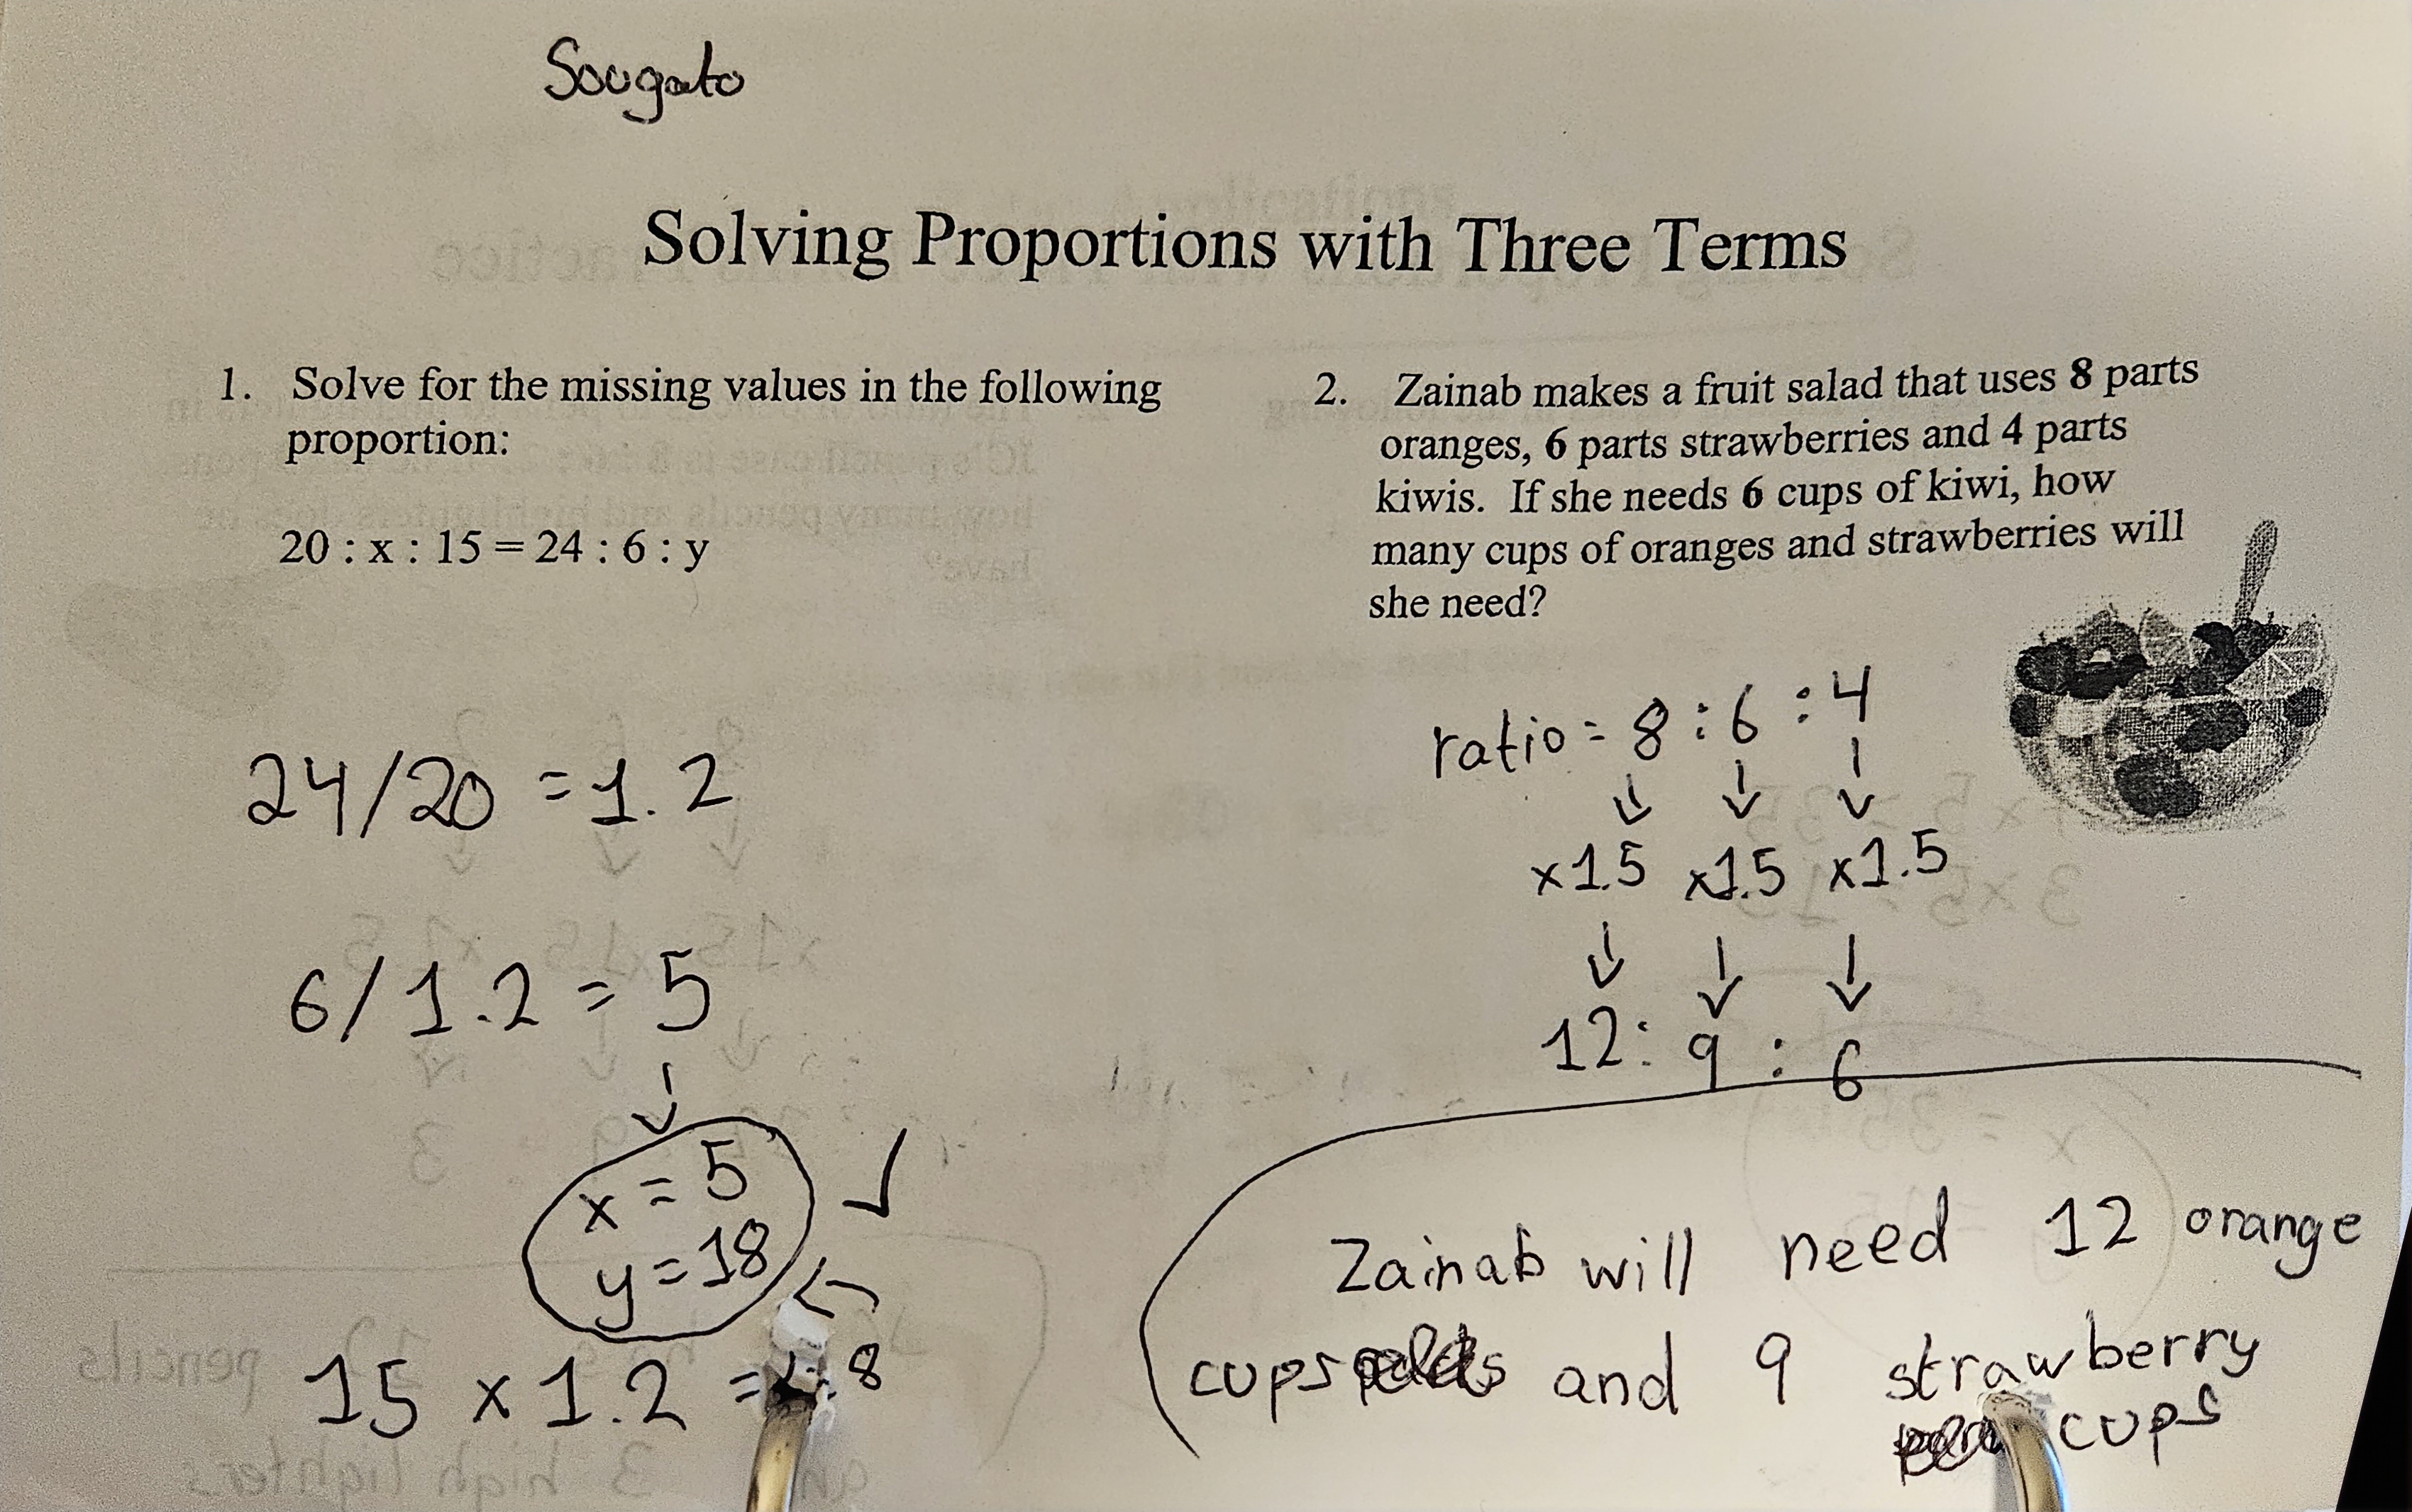
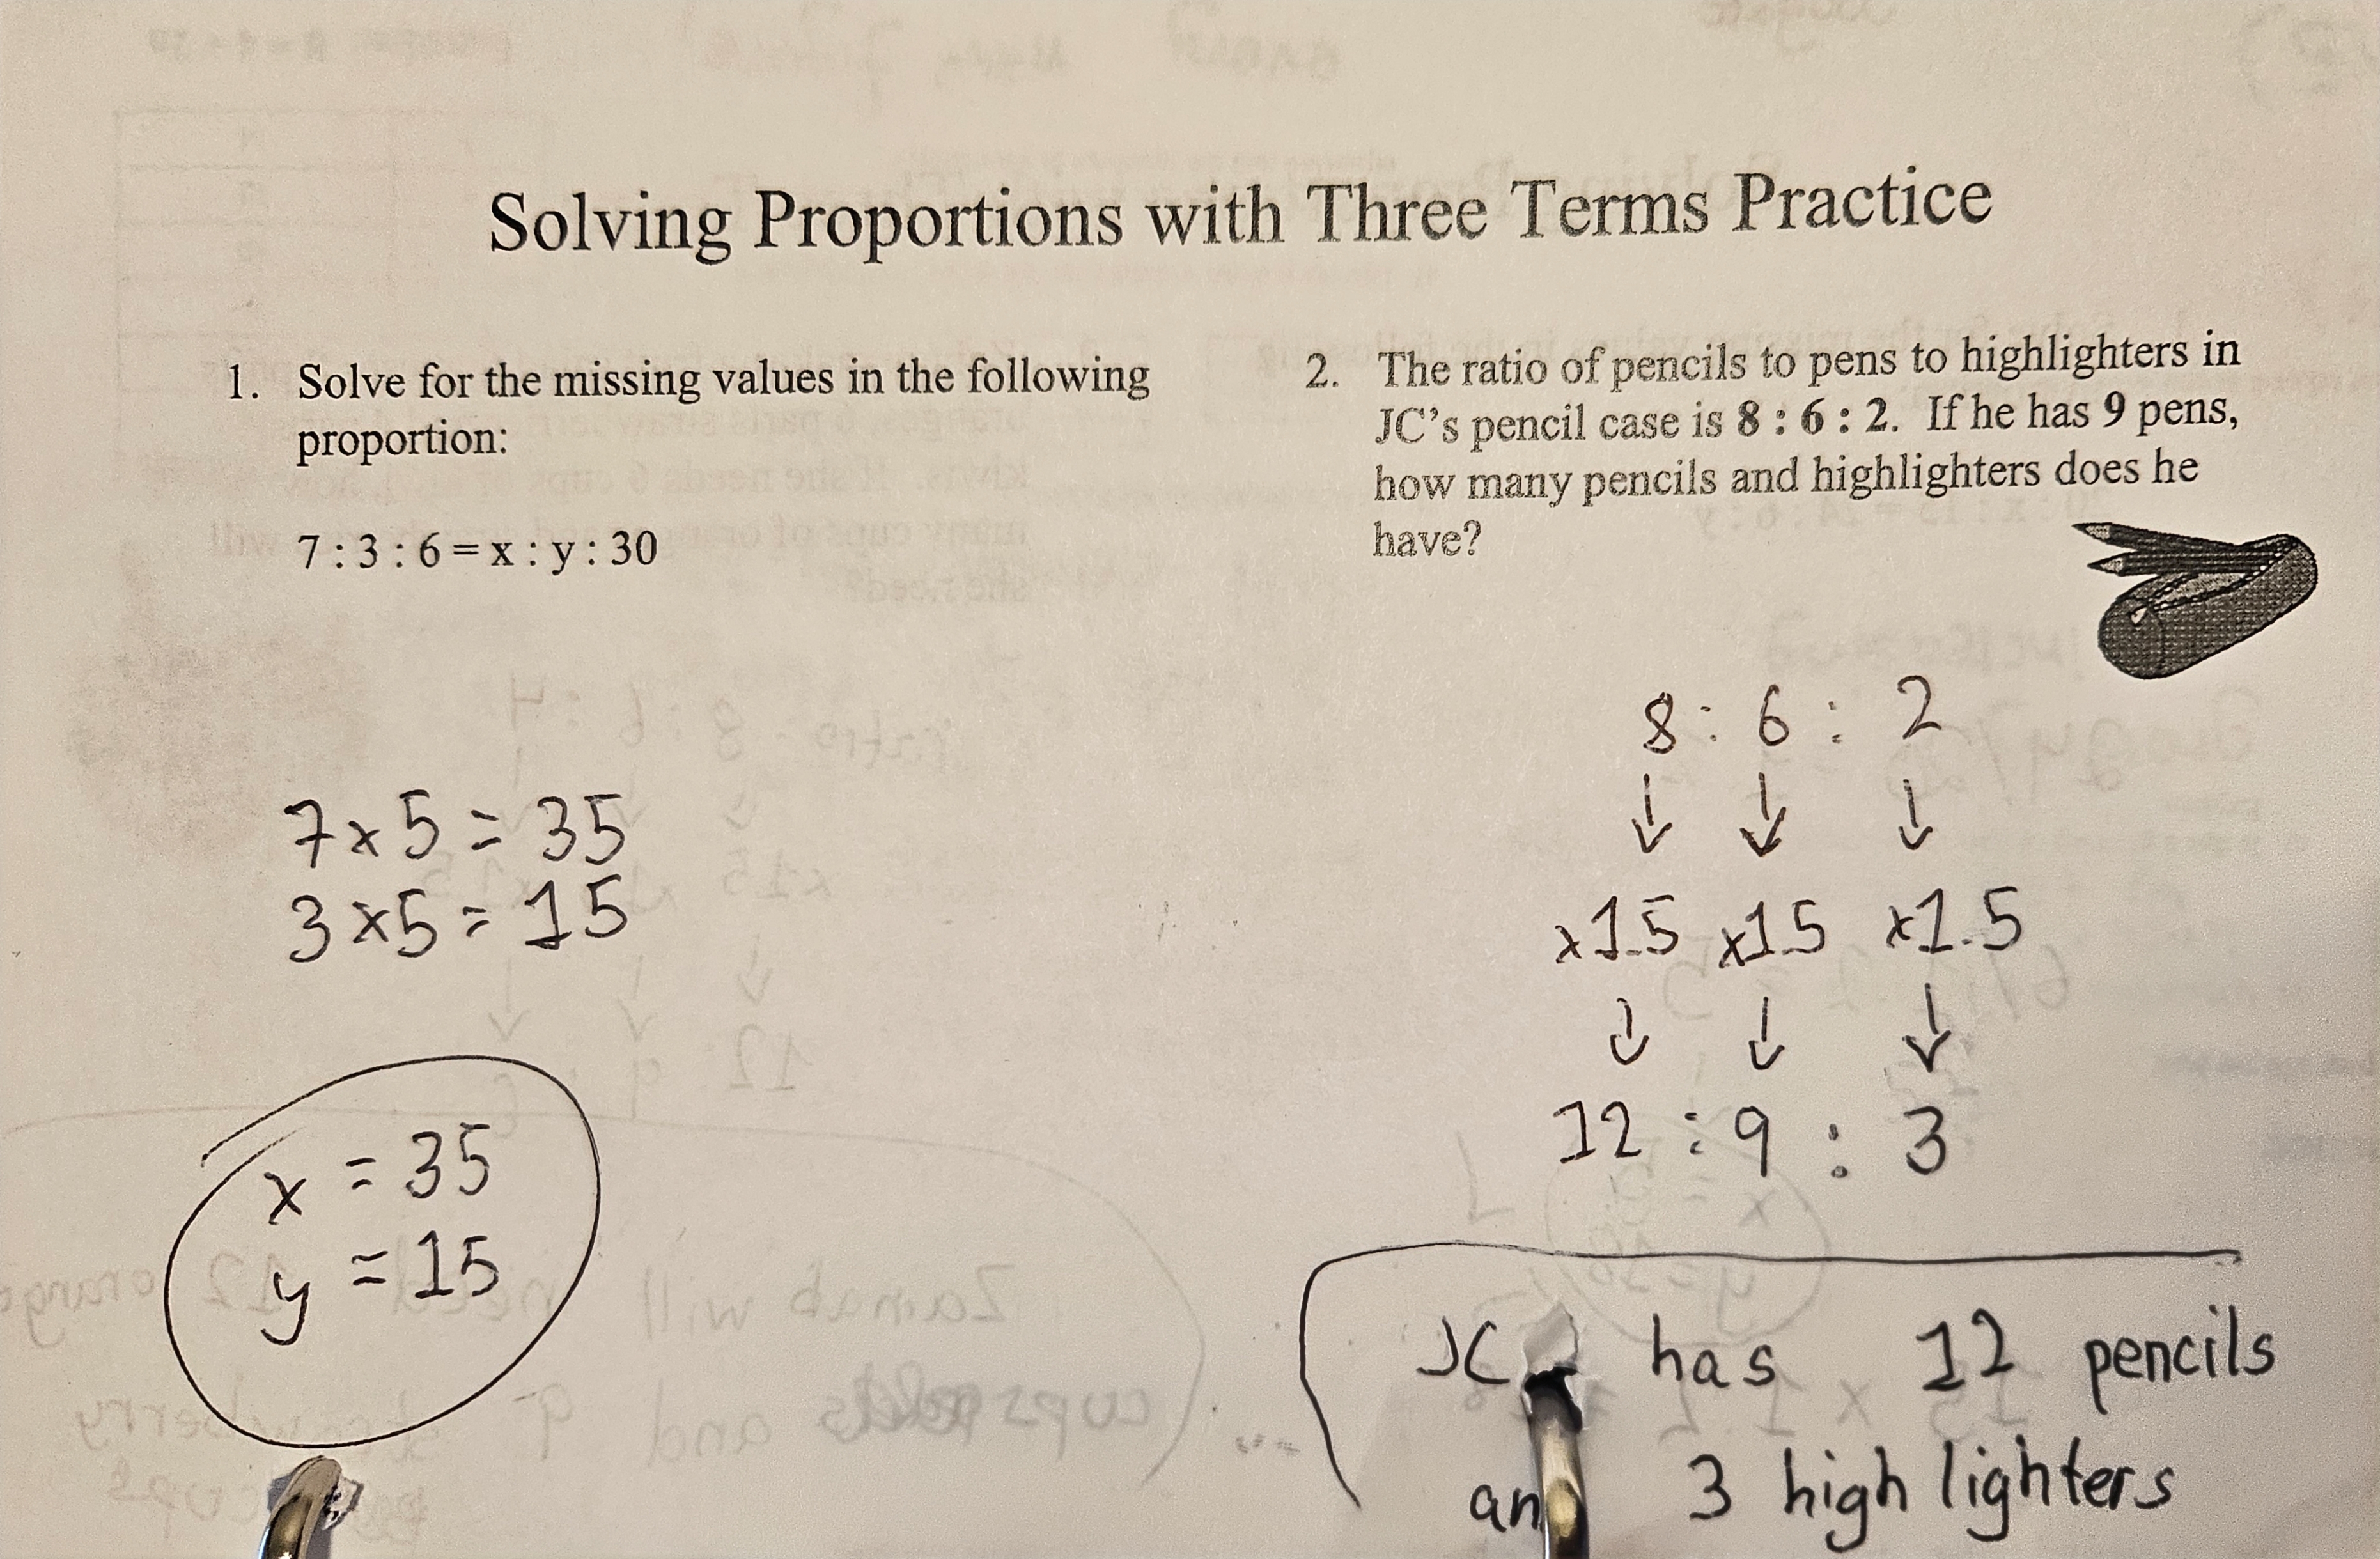
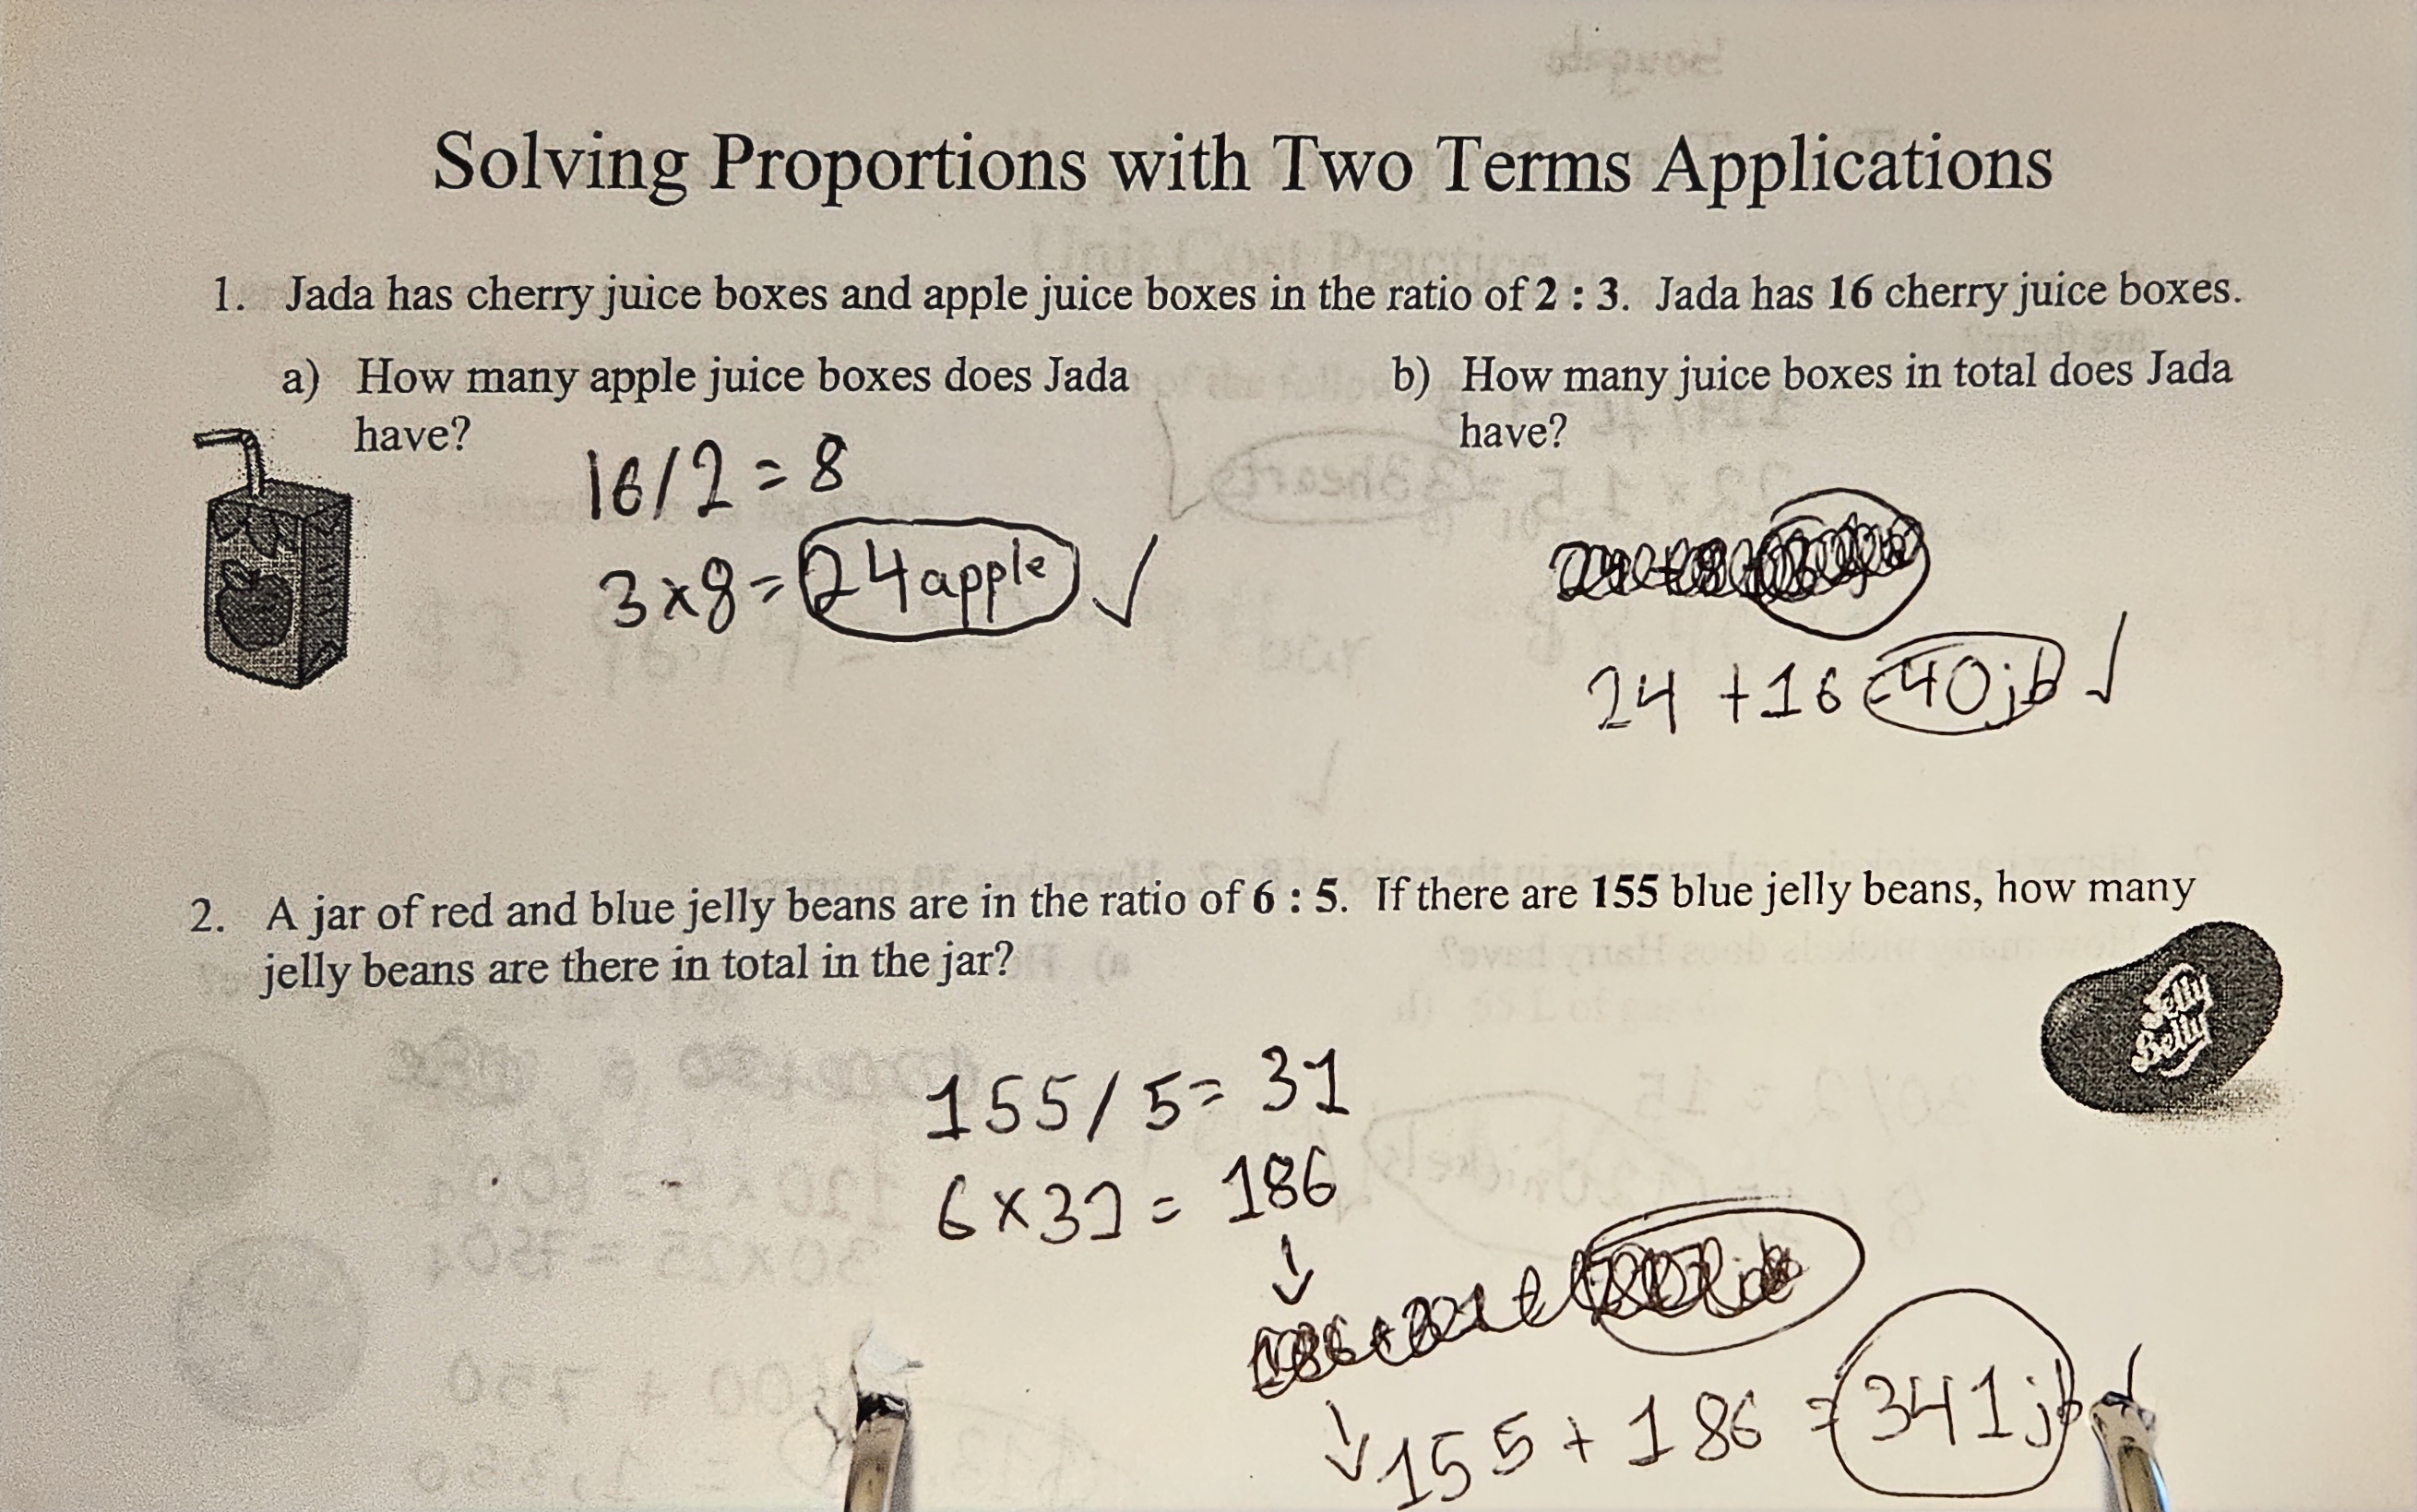
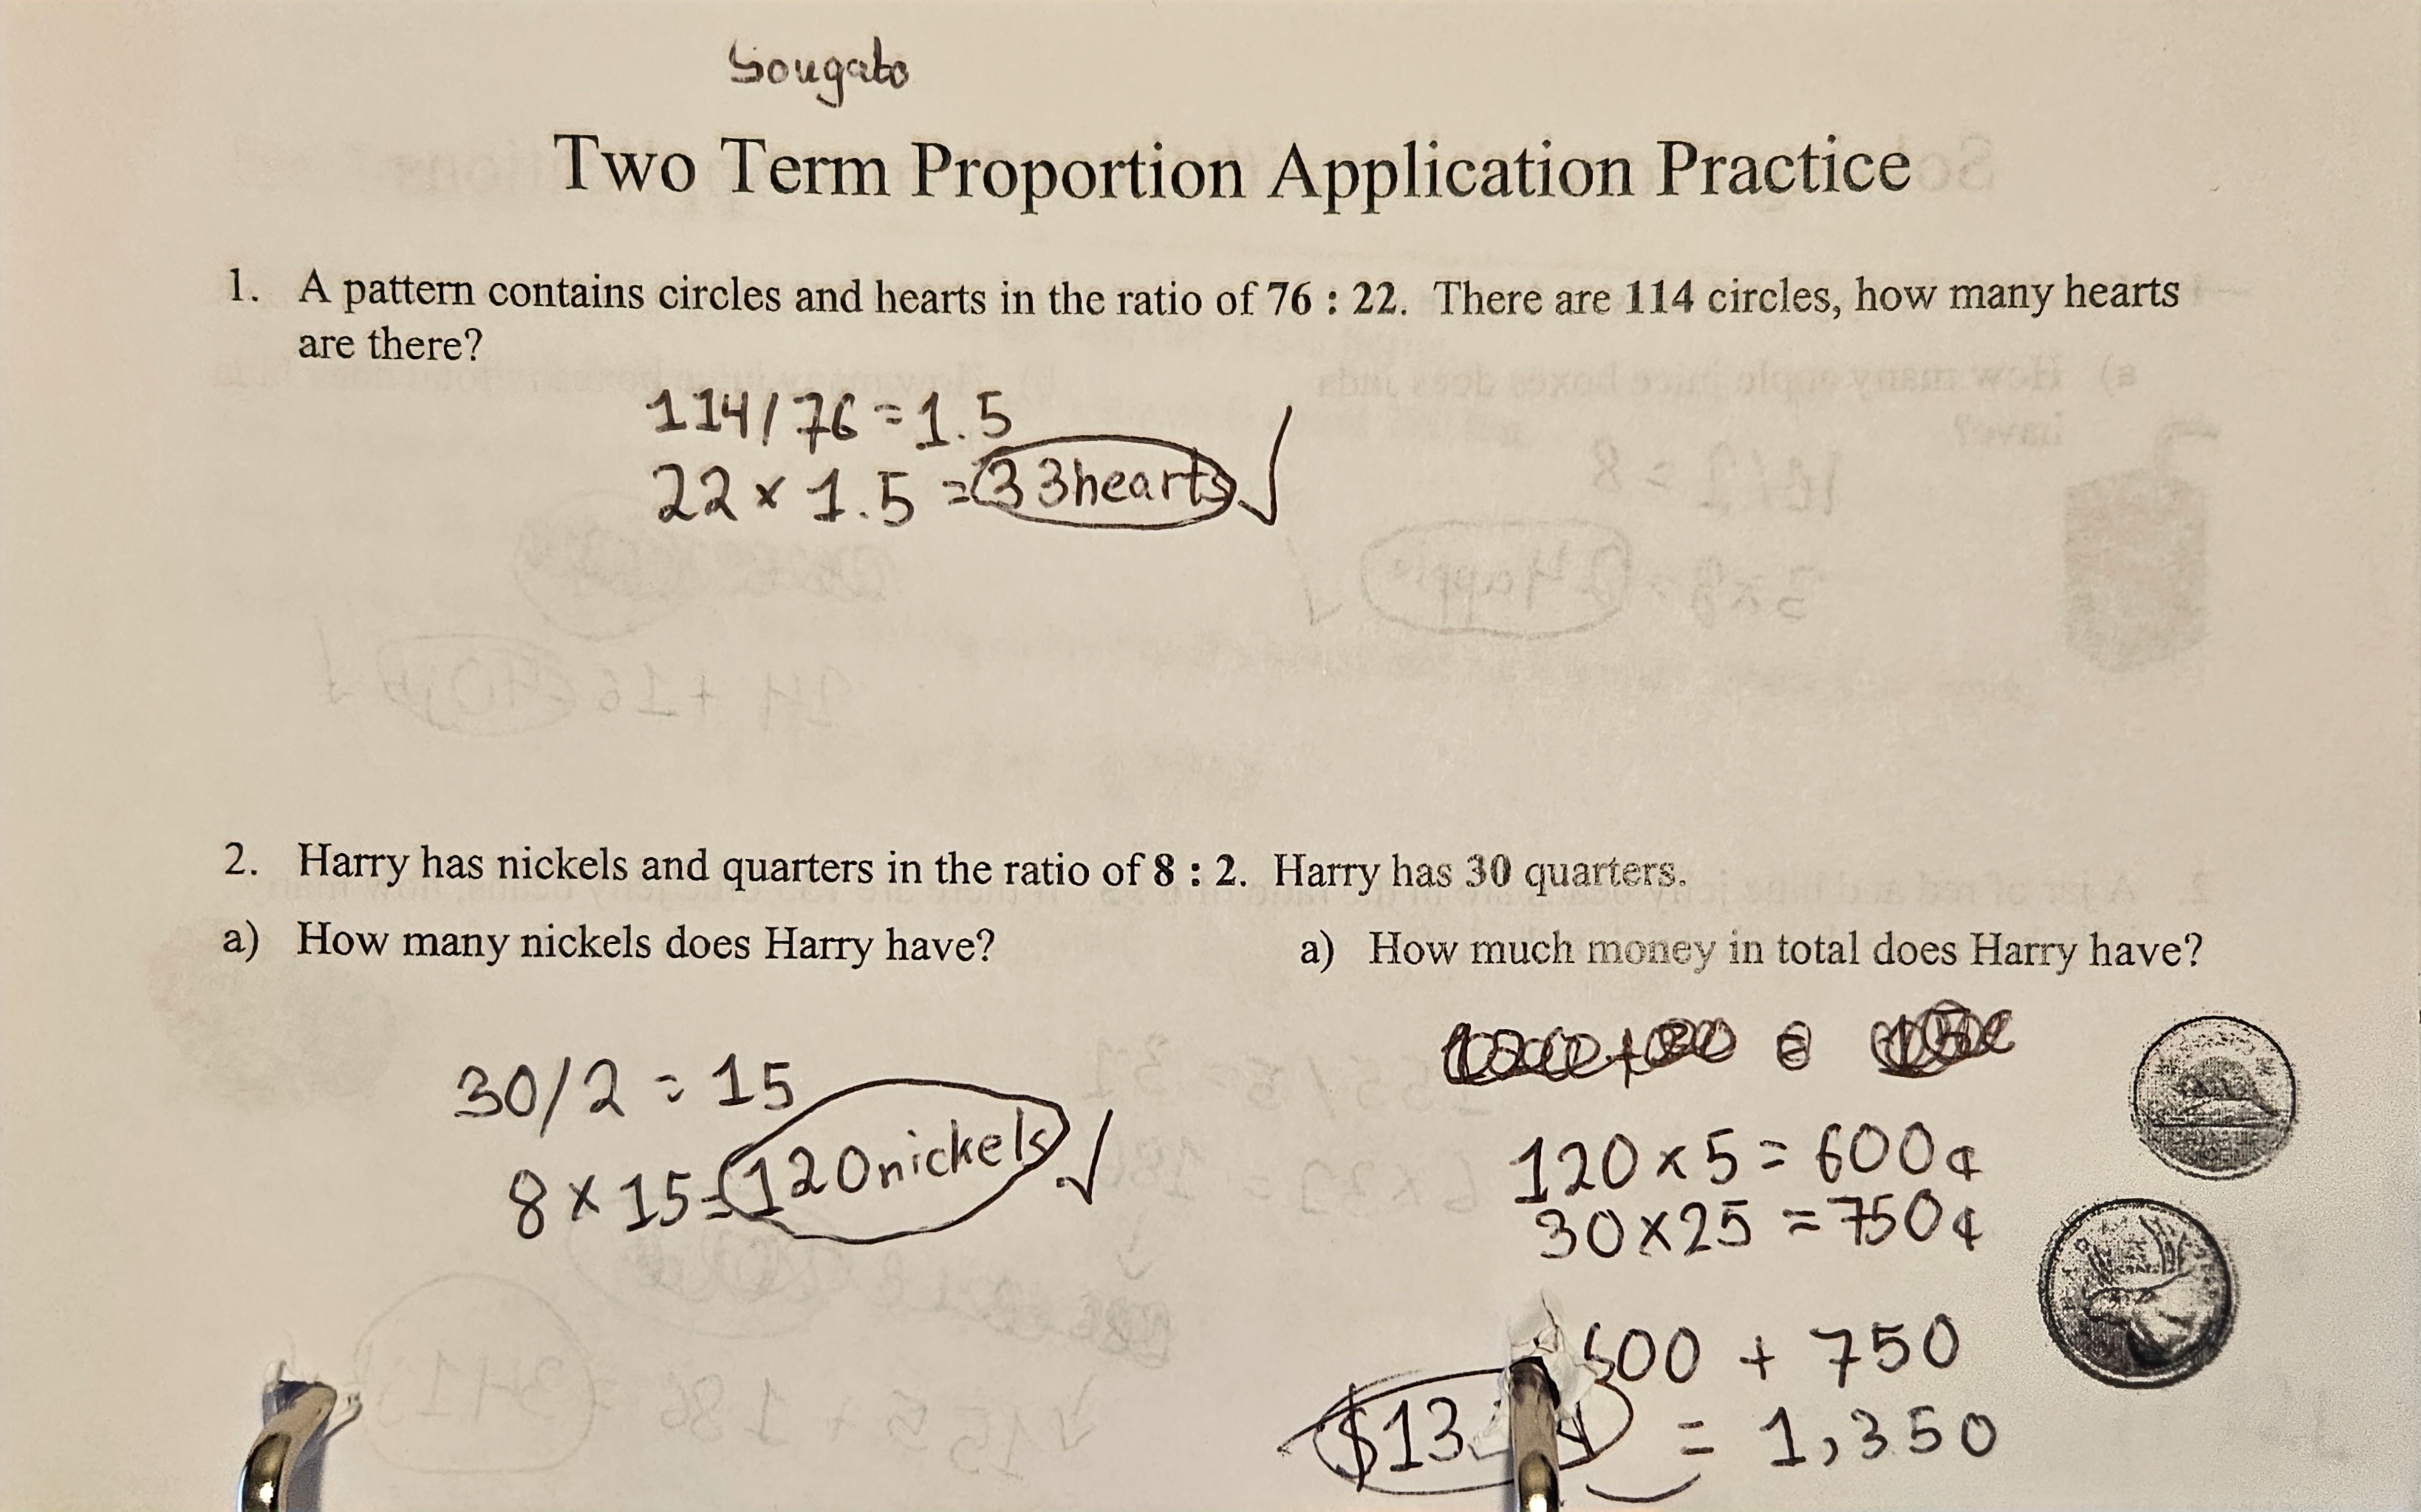
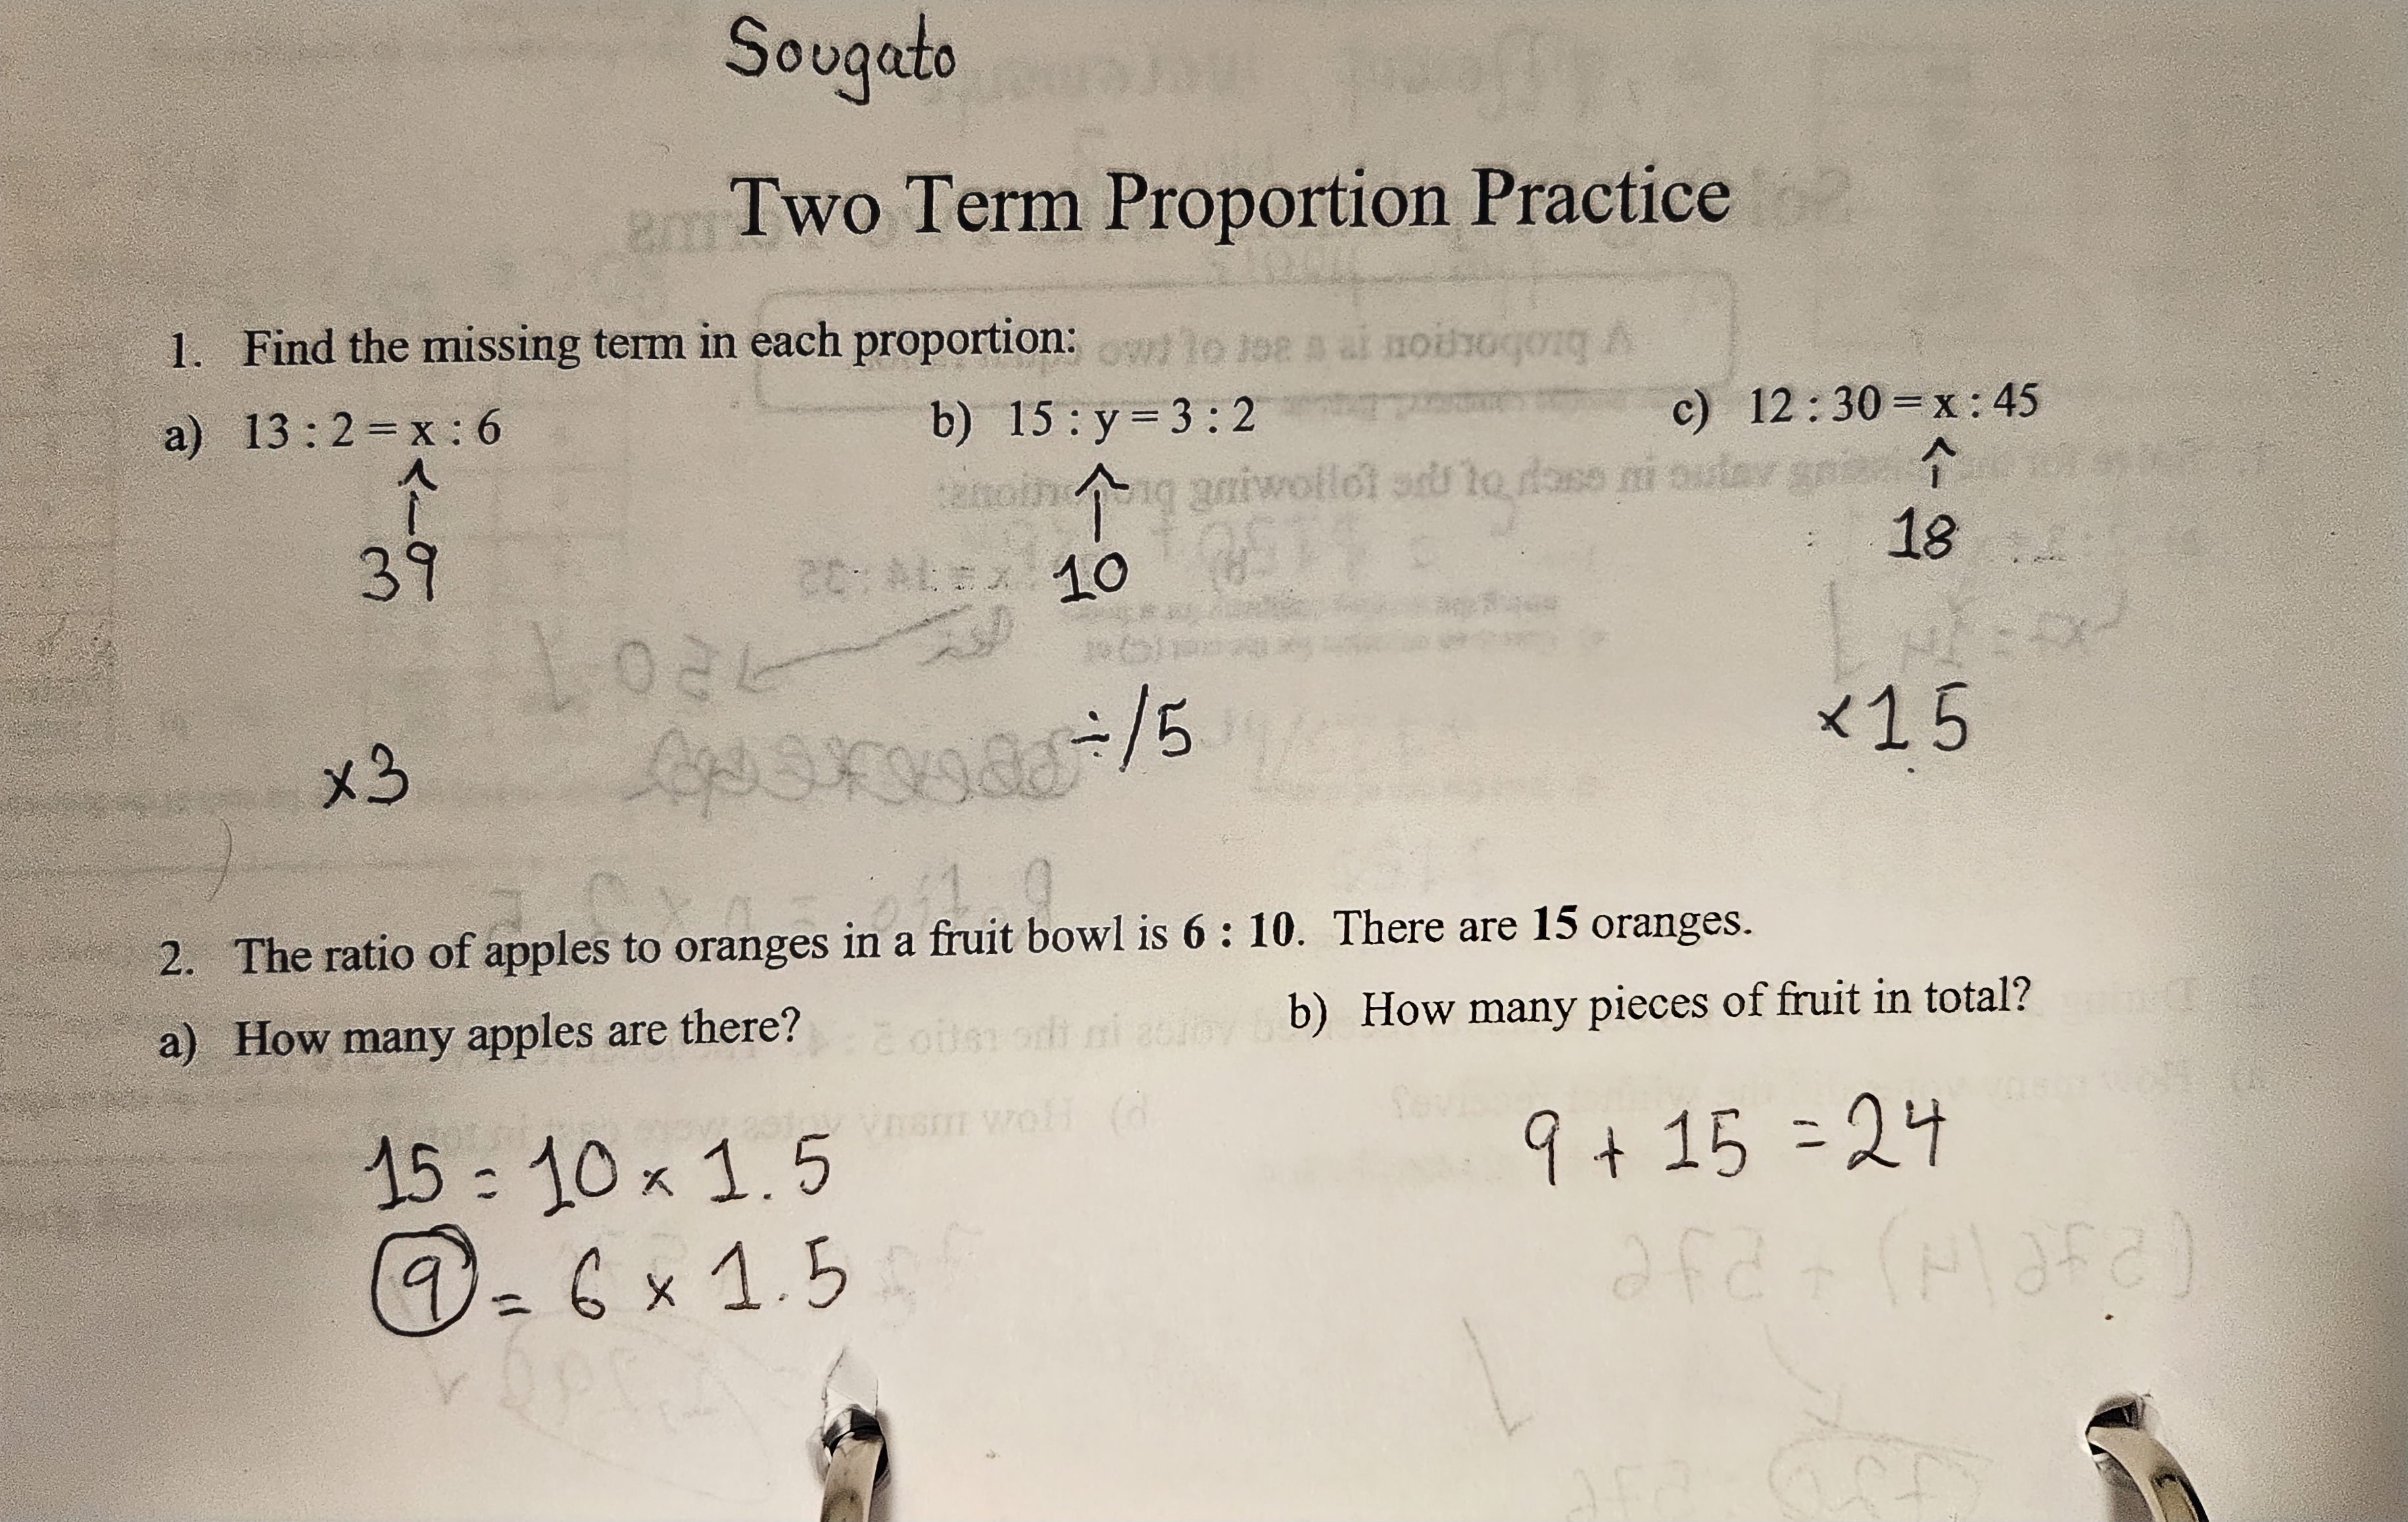
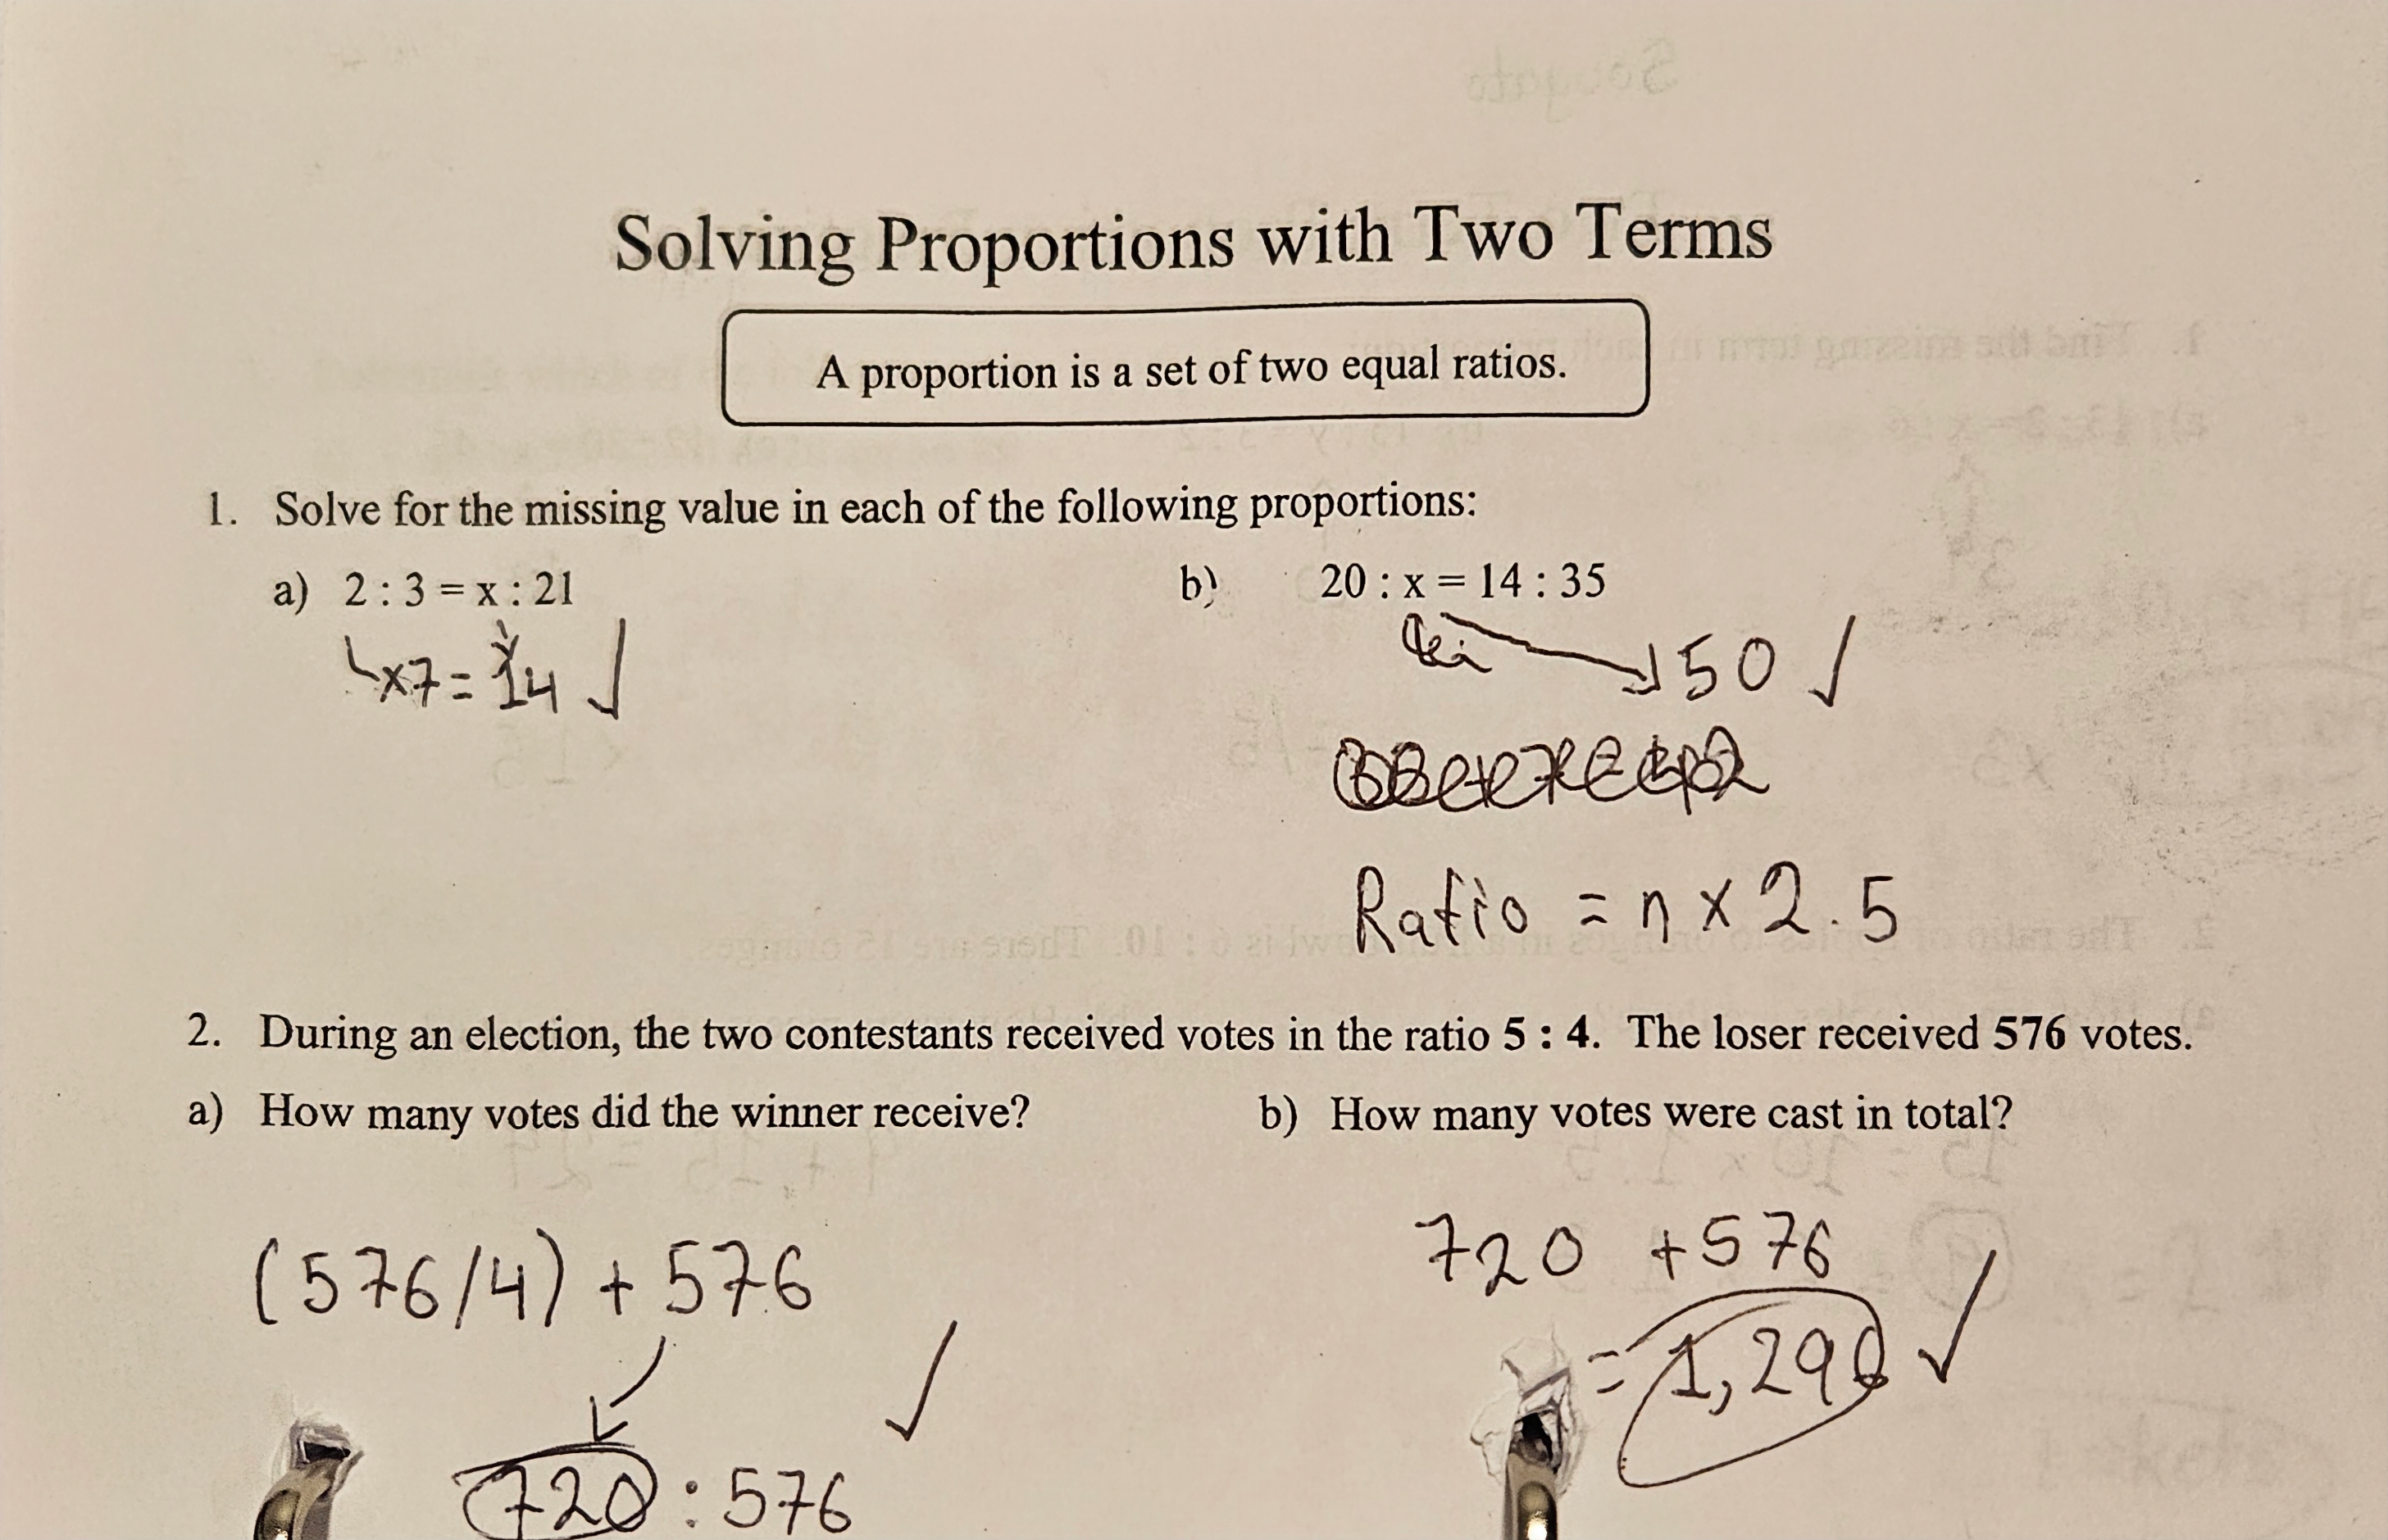
The images shown above are practice questions including 2 and 3 term proportions.
2 term proportions - in order to compare 2 ratios, the denominator must be equal on both ratios. In order to convert this, we must find the lowest common denomintor between the ratios. While converting, we must ensure that the same operation is also applied to the numerator. An example of this entire process would be having ratios such as 2:3 and 5:6 which is then converted to 4:6 and 5:6. In this case, 6 was the lowest denominator. After converting the compared ratios, we may determine the larger ratio, add them, etc. The last 4 images contain examples and questions with this topic.
3 term proportions - with 3 terms, the concept remains, except the common denominator must be common between all 3 ratios. An example of this is 2:3, 4:6 and 7:9, which can be converted to 6:9, 6:9 and 7:9 with 9 being the lowest common denominator. More examples of this are included in the first 2 images.
Scientific Notation
Scientific notation is used for simplifying extremely large or small numbers using exponents.
Let's take 13 000 as an example. It's a very large number to work with. First we remove the 3 zeros and remain with 13, which will be converted to 1.3 as scientific notation cannot exceed 9. Our formula is now 1.3 x 10, which we need to add exponents to. Because we removed 3 zeros earlier, we cube 10.
Our final answer is 1.3 x 10^3. Much shorter and easy to read. We can check our answer by solving this statement.
Scientific notation can deal with smaller numbers too. Our example here will be 0.0023. Like before, we'll take the 3 zeros away as well as the decimal point and convert to 2.3. In order to find the exponent here, we'll cube 10 again as there were 3 zeros removed; an important step is to ensure that the cubing is negative, as we need the 10 to get smaller when cubed. Our final answer would be 2.3 x 10^-3 which again would give us our starting value if solved.
Number Sets/Types
During the course of this year, we have learnt to classify types of numbers in order to simplify understanding of equations. Below are some of our definitions:
Whole Number - Any full number without any decimal value, e.g 12
Integer - Any negative or positive number, e.g. -2
Rational Numbers - As the name mentions, rational numbers are a way of expressing parts of a whole. This can come in the form of a fraction, terminating decimal, repeating decimal, e.g 0.883
Coding
In math class, the main coding language we focused on is Python. Python is an object oriented, human readable programming language. Python is great for multipurpose and data management solutions, as well as being easy to learn for beginners.
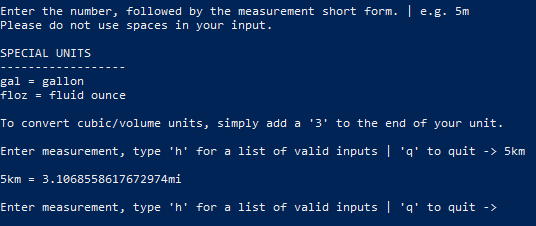
The project I created in class is a unit converter that automatically converts given metric or imperial units to its opposite value. I think I demonstrated good coding skills by using correct, organised indentation as well as notation, while also using a variety of keywords and conditional statements in my file.
Below is the code I used for this project, as well as some comments to explain the code.
Click here! - Link to code has been provided for decluttering purposes.
Below is an example of possible input and output. If the text is too small, click to enlarge the image in a new tab.
Algebra
Algebra was a heavy topic covered in math class. We learnt about incorporating algebraic concepts into our math schema. Some techniques I remember well are reverse operations in equations (SAMDEB), equilibrium between 2 sides of an equation, etc. Based on my scenario, I have learnt to adapt my method to solve the equation. An example of this is collecting like terms in an expression in order to better tackle the overall question.
Definitions
Before continuing to some work done in class, let's define some key terms for this unit:
Variable - Can be defined or undefined, it represents something else and can be changed. E.g. x
Constant - Is a value that cannot change, usually just a number. E.g. 2
Term - Essentially a single part of an equation. E.g. -3x
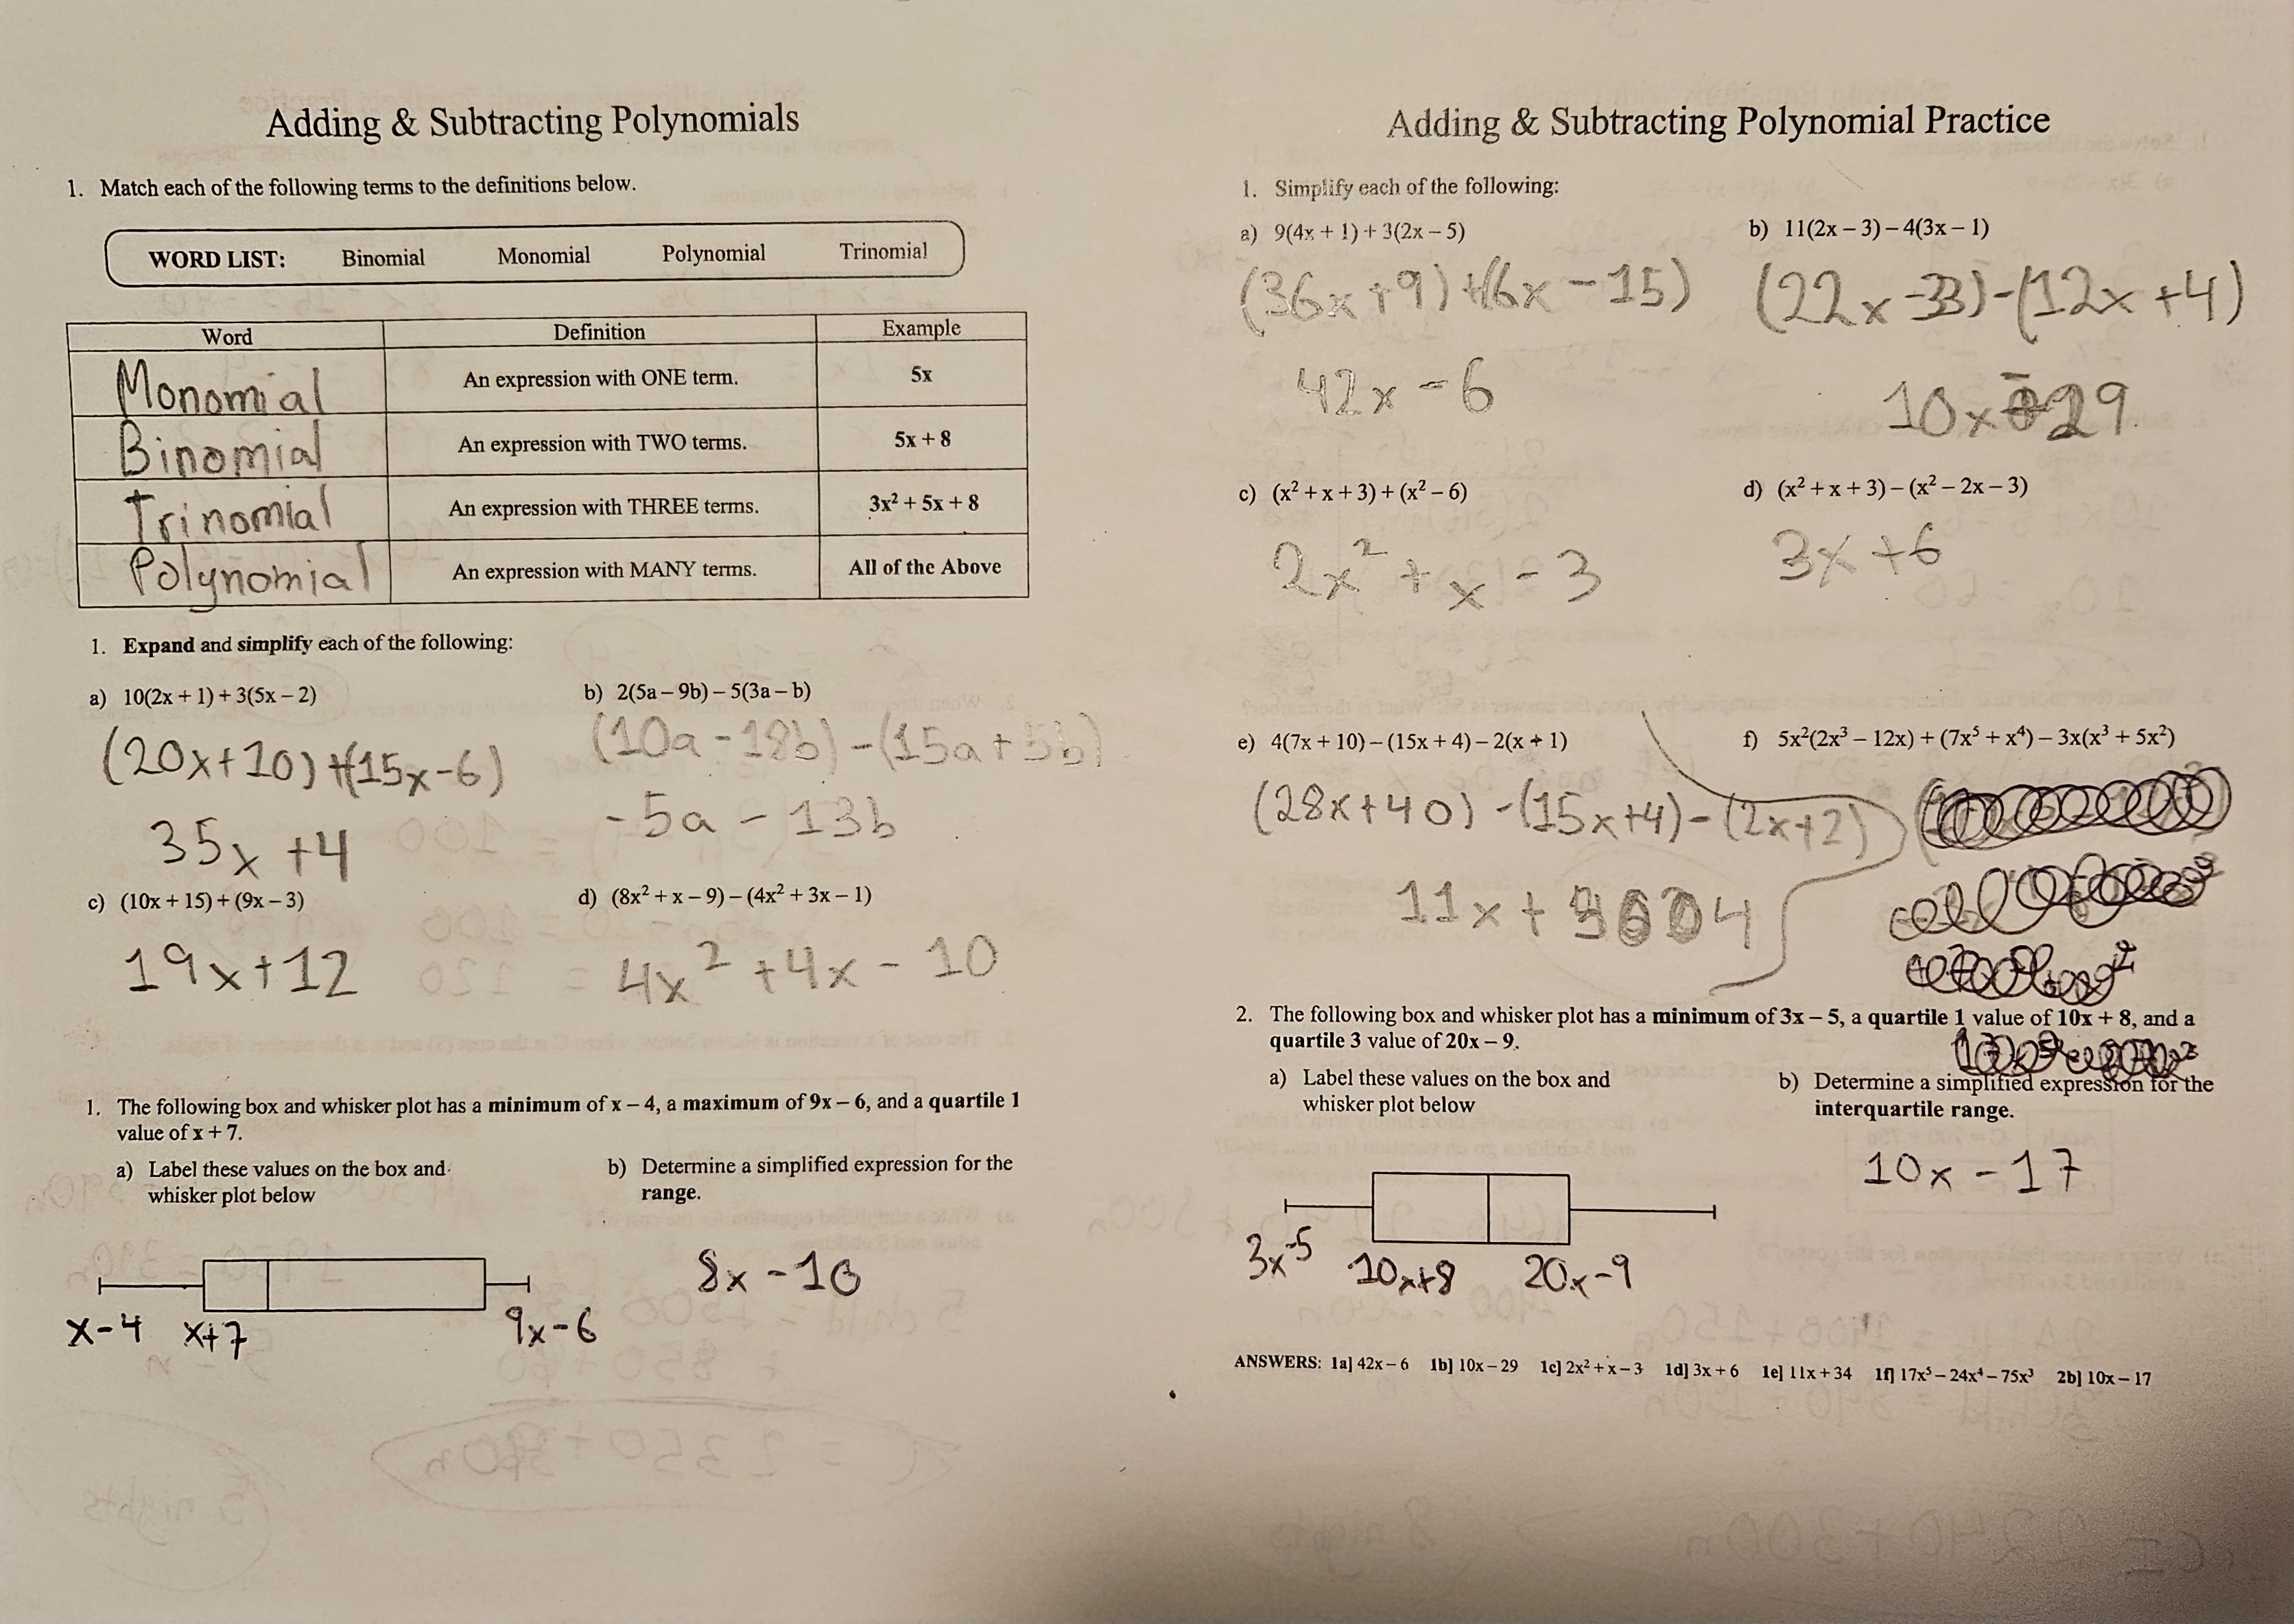
As for equation terms, polynomials are what we use in order to describe an equation with many terms. We categorise these equations based on the amount of terms (Mono, Bino, Trino = 1 term, 2 term, 3 term). Below is some work I have completed which includes me filling a chart with these terms.
Solving Equations
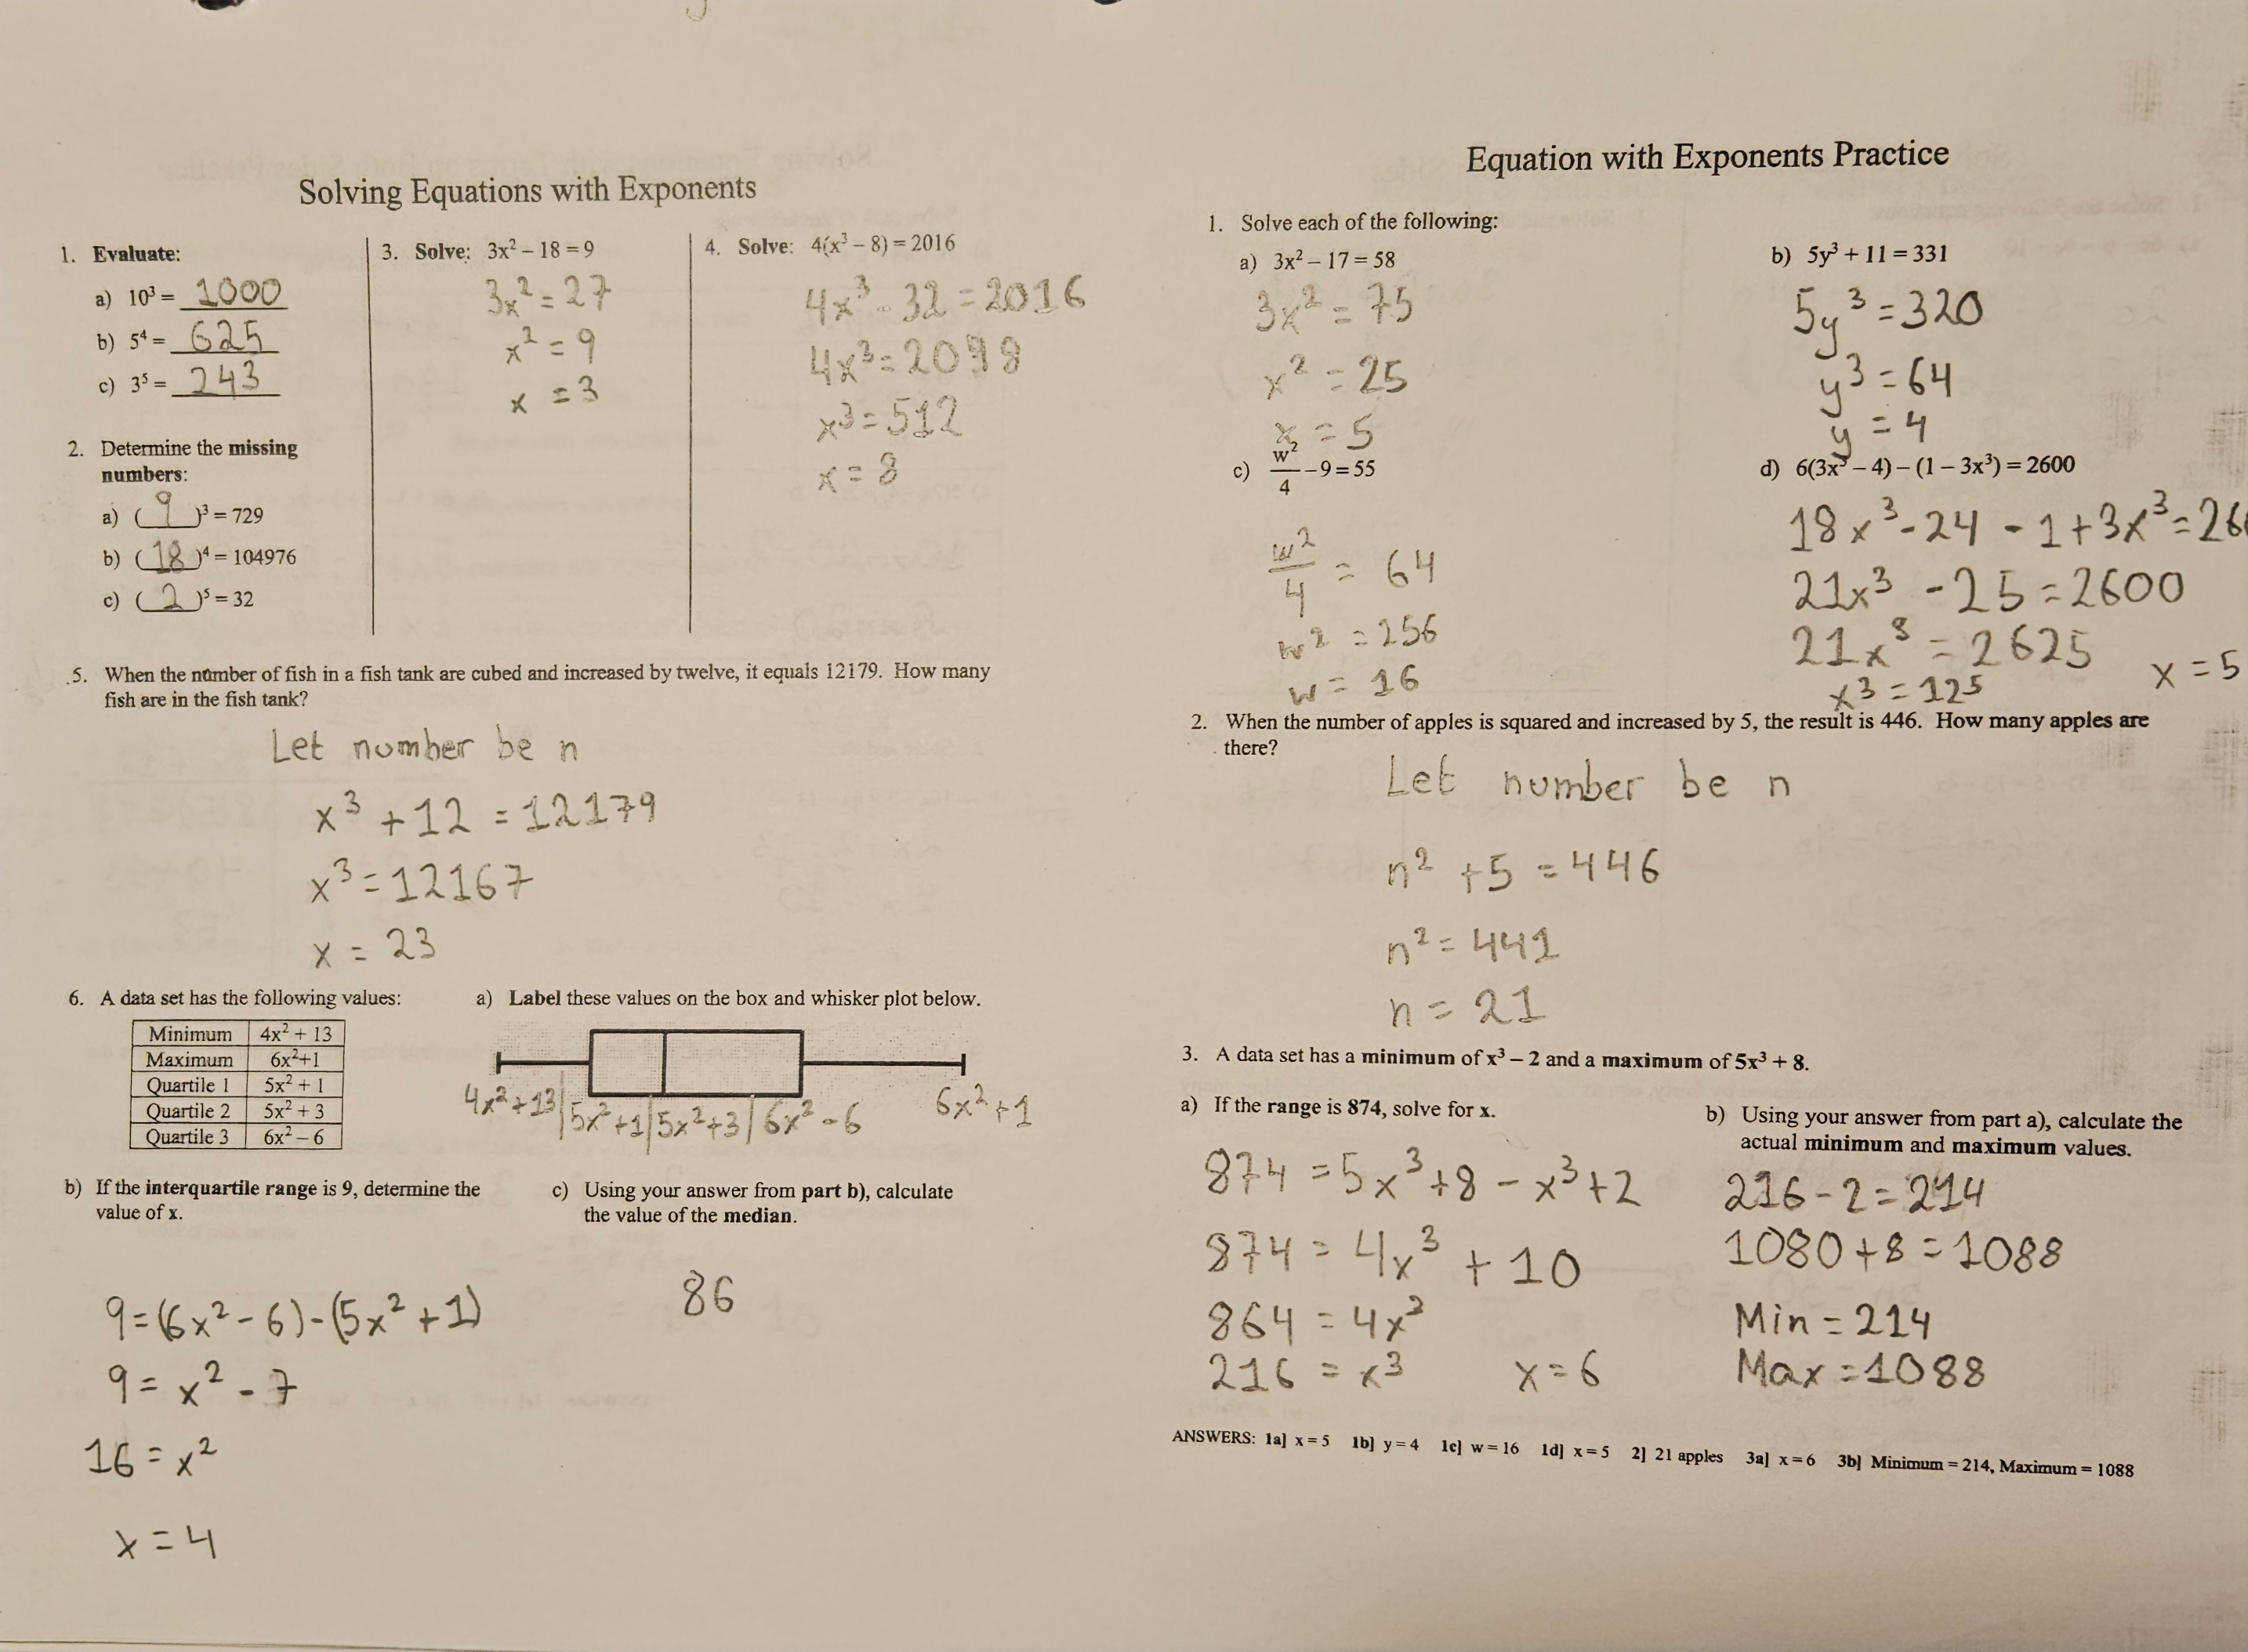
In the first image below, we go over some practice questions using equations, let's dive into a singular question and break down the process of solving a problem with variables.
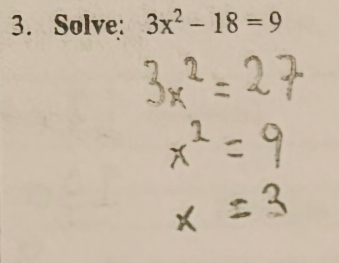
Attached (second image) is a question that asks us to solve for x in 3x^2 - 18 = 9. First we need to use SAMDEB (reverse order of operations, BEDMAS) in order to determine what to remove from the left in order to simplify that side. In this case, we will reverse the subtraction and make it addition to the 9 on the other side. 18 + 9 = 27. Now our equation is currently 3x^2 = 27. Next we need to reverse the multiplication which is division. 27/3 = 9 which leaves our equation at x^2 = 9. We only have one part to reverse here, which means we need to find the square root of 9 (what can be squared to get 9?), which leaves us with x = 3.
Solving Equations with Like Terms
Collecting like terms is an efficient method to simplify equations, amking them easier to read and solve in larger scale equations.
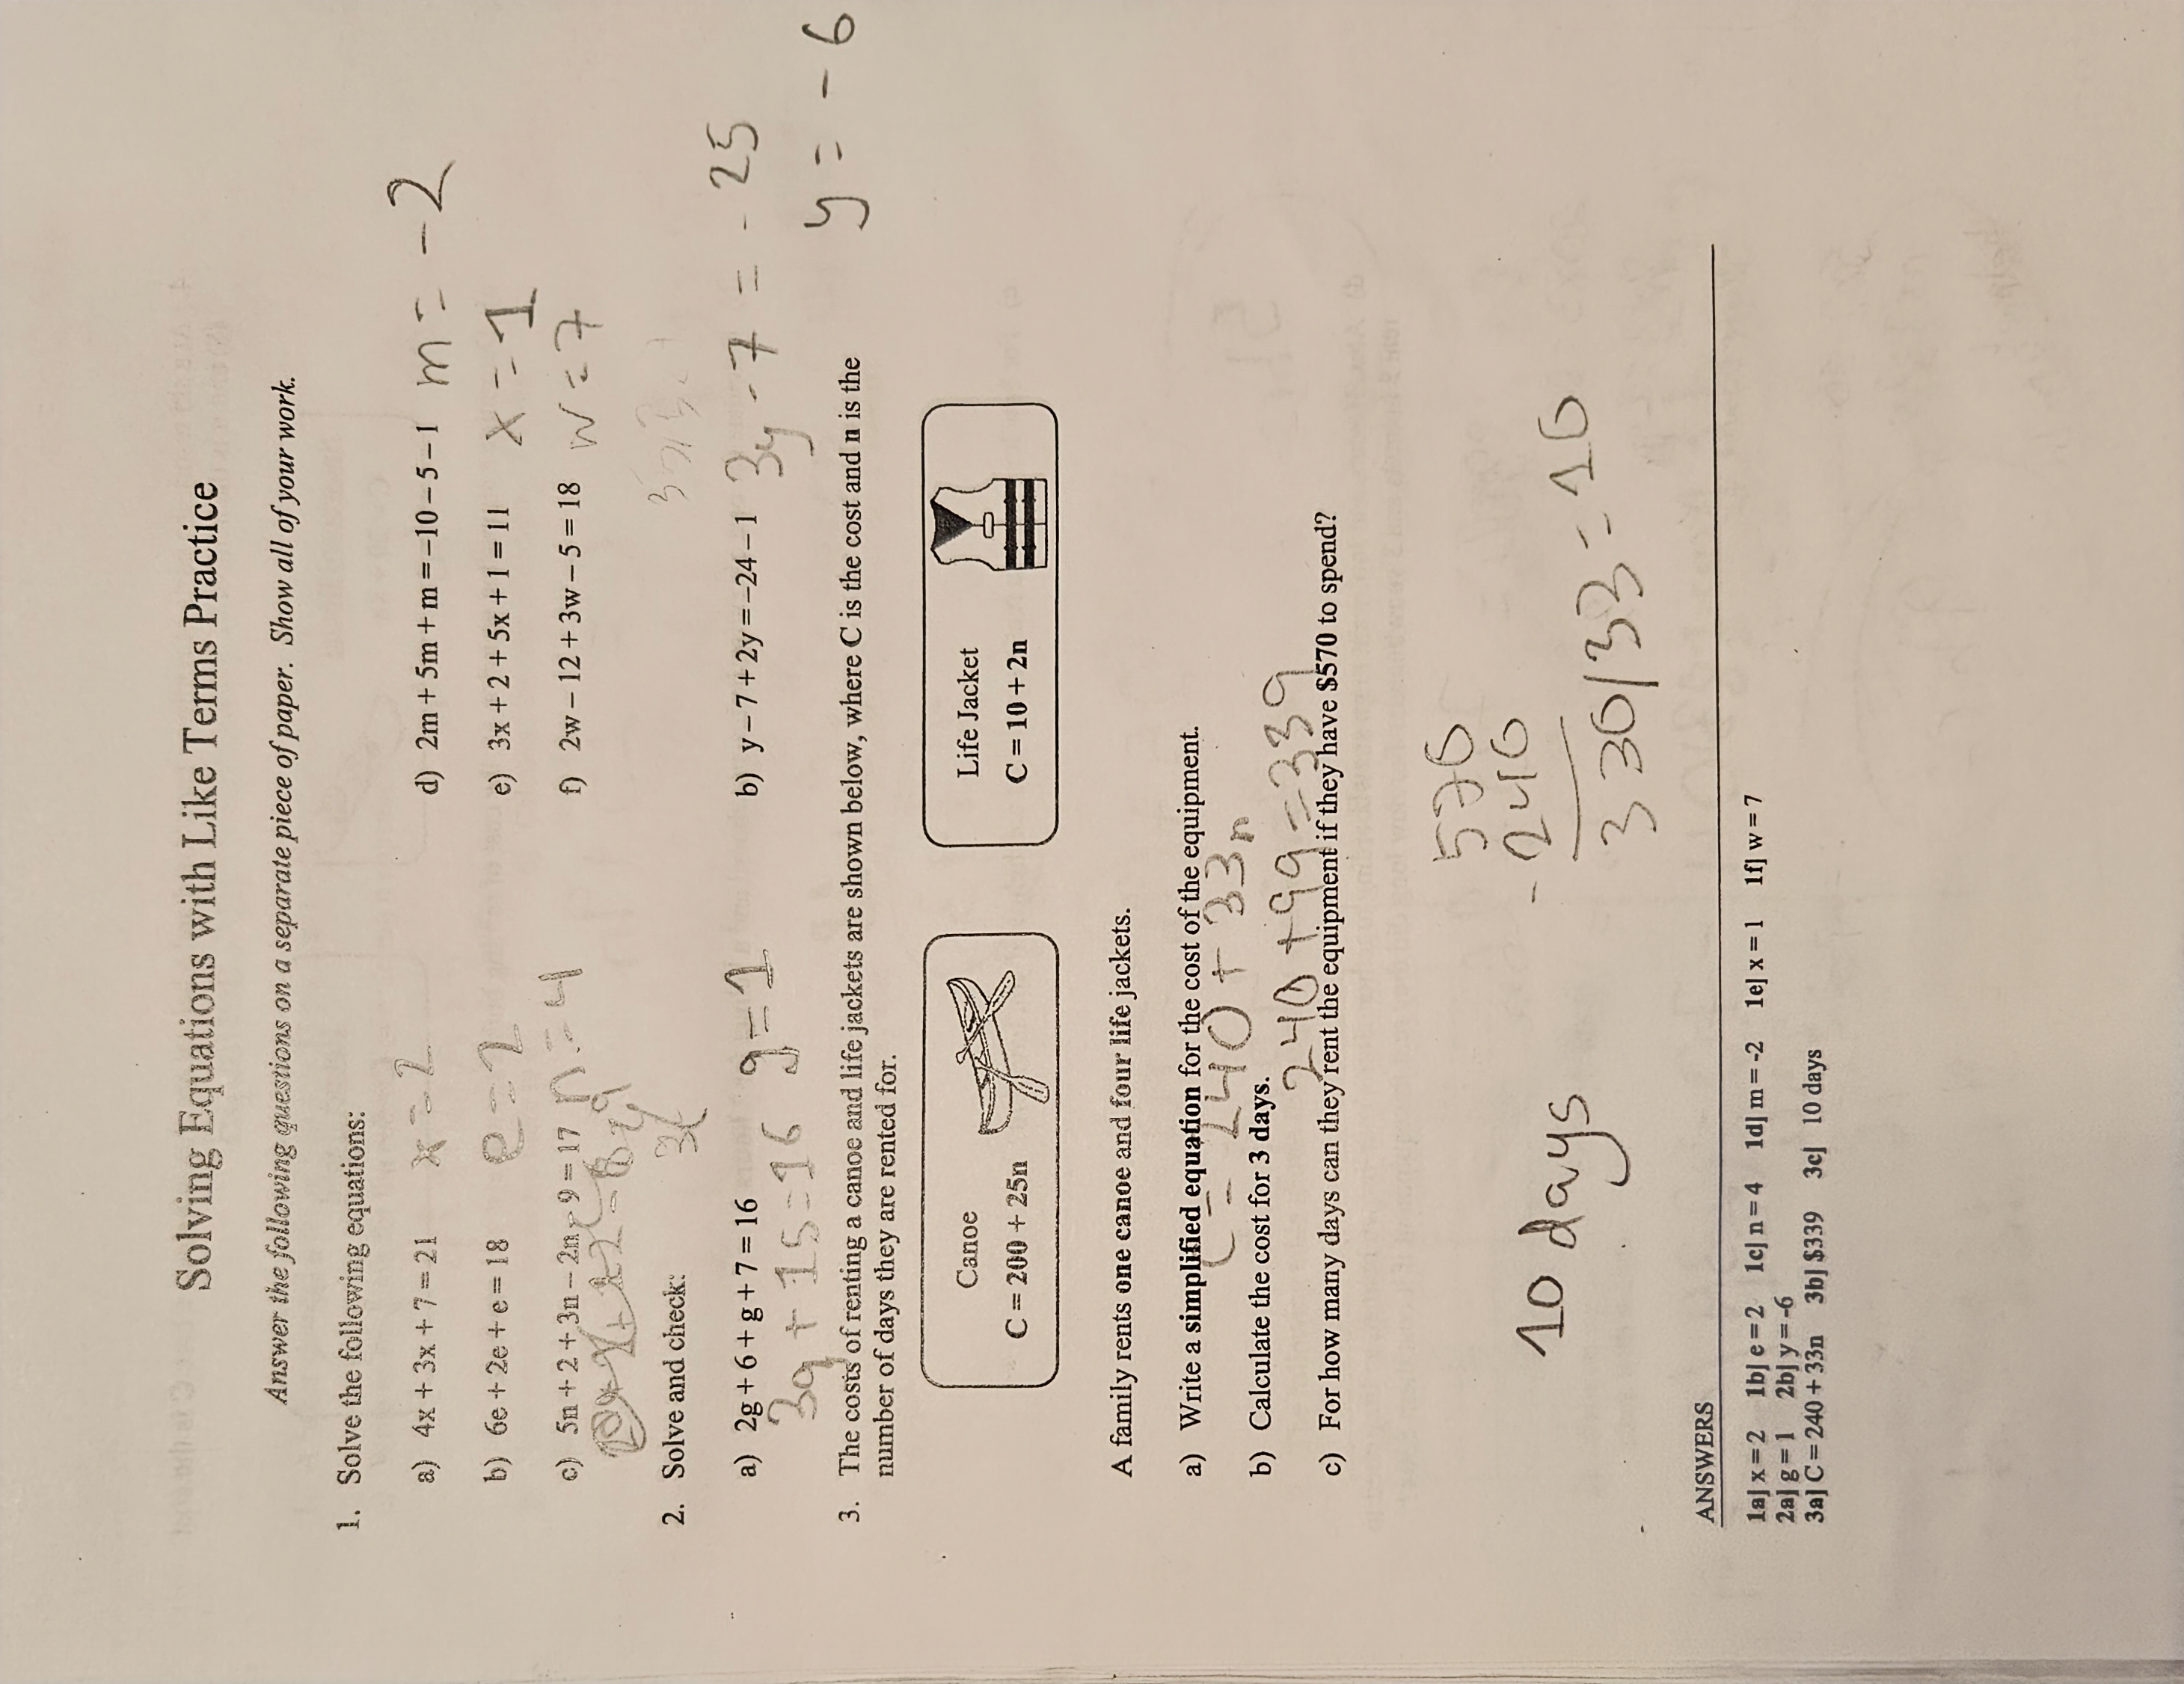
4x + 3x + 7 = 21
This is an example of a question where we can group like terms. Like terms must have the same variable and exponent. 4x and 3x are both positive terms with the same variable, allowing us to group them as 7x. Now we know 7x + 7 = 21. Reversing + 7 and removing it from 21 leaves us with 7x = 14. One final division (14/7) means that x = 2.
Solving Equations with Terms on Both Sides
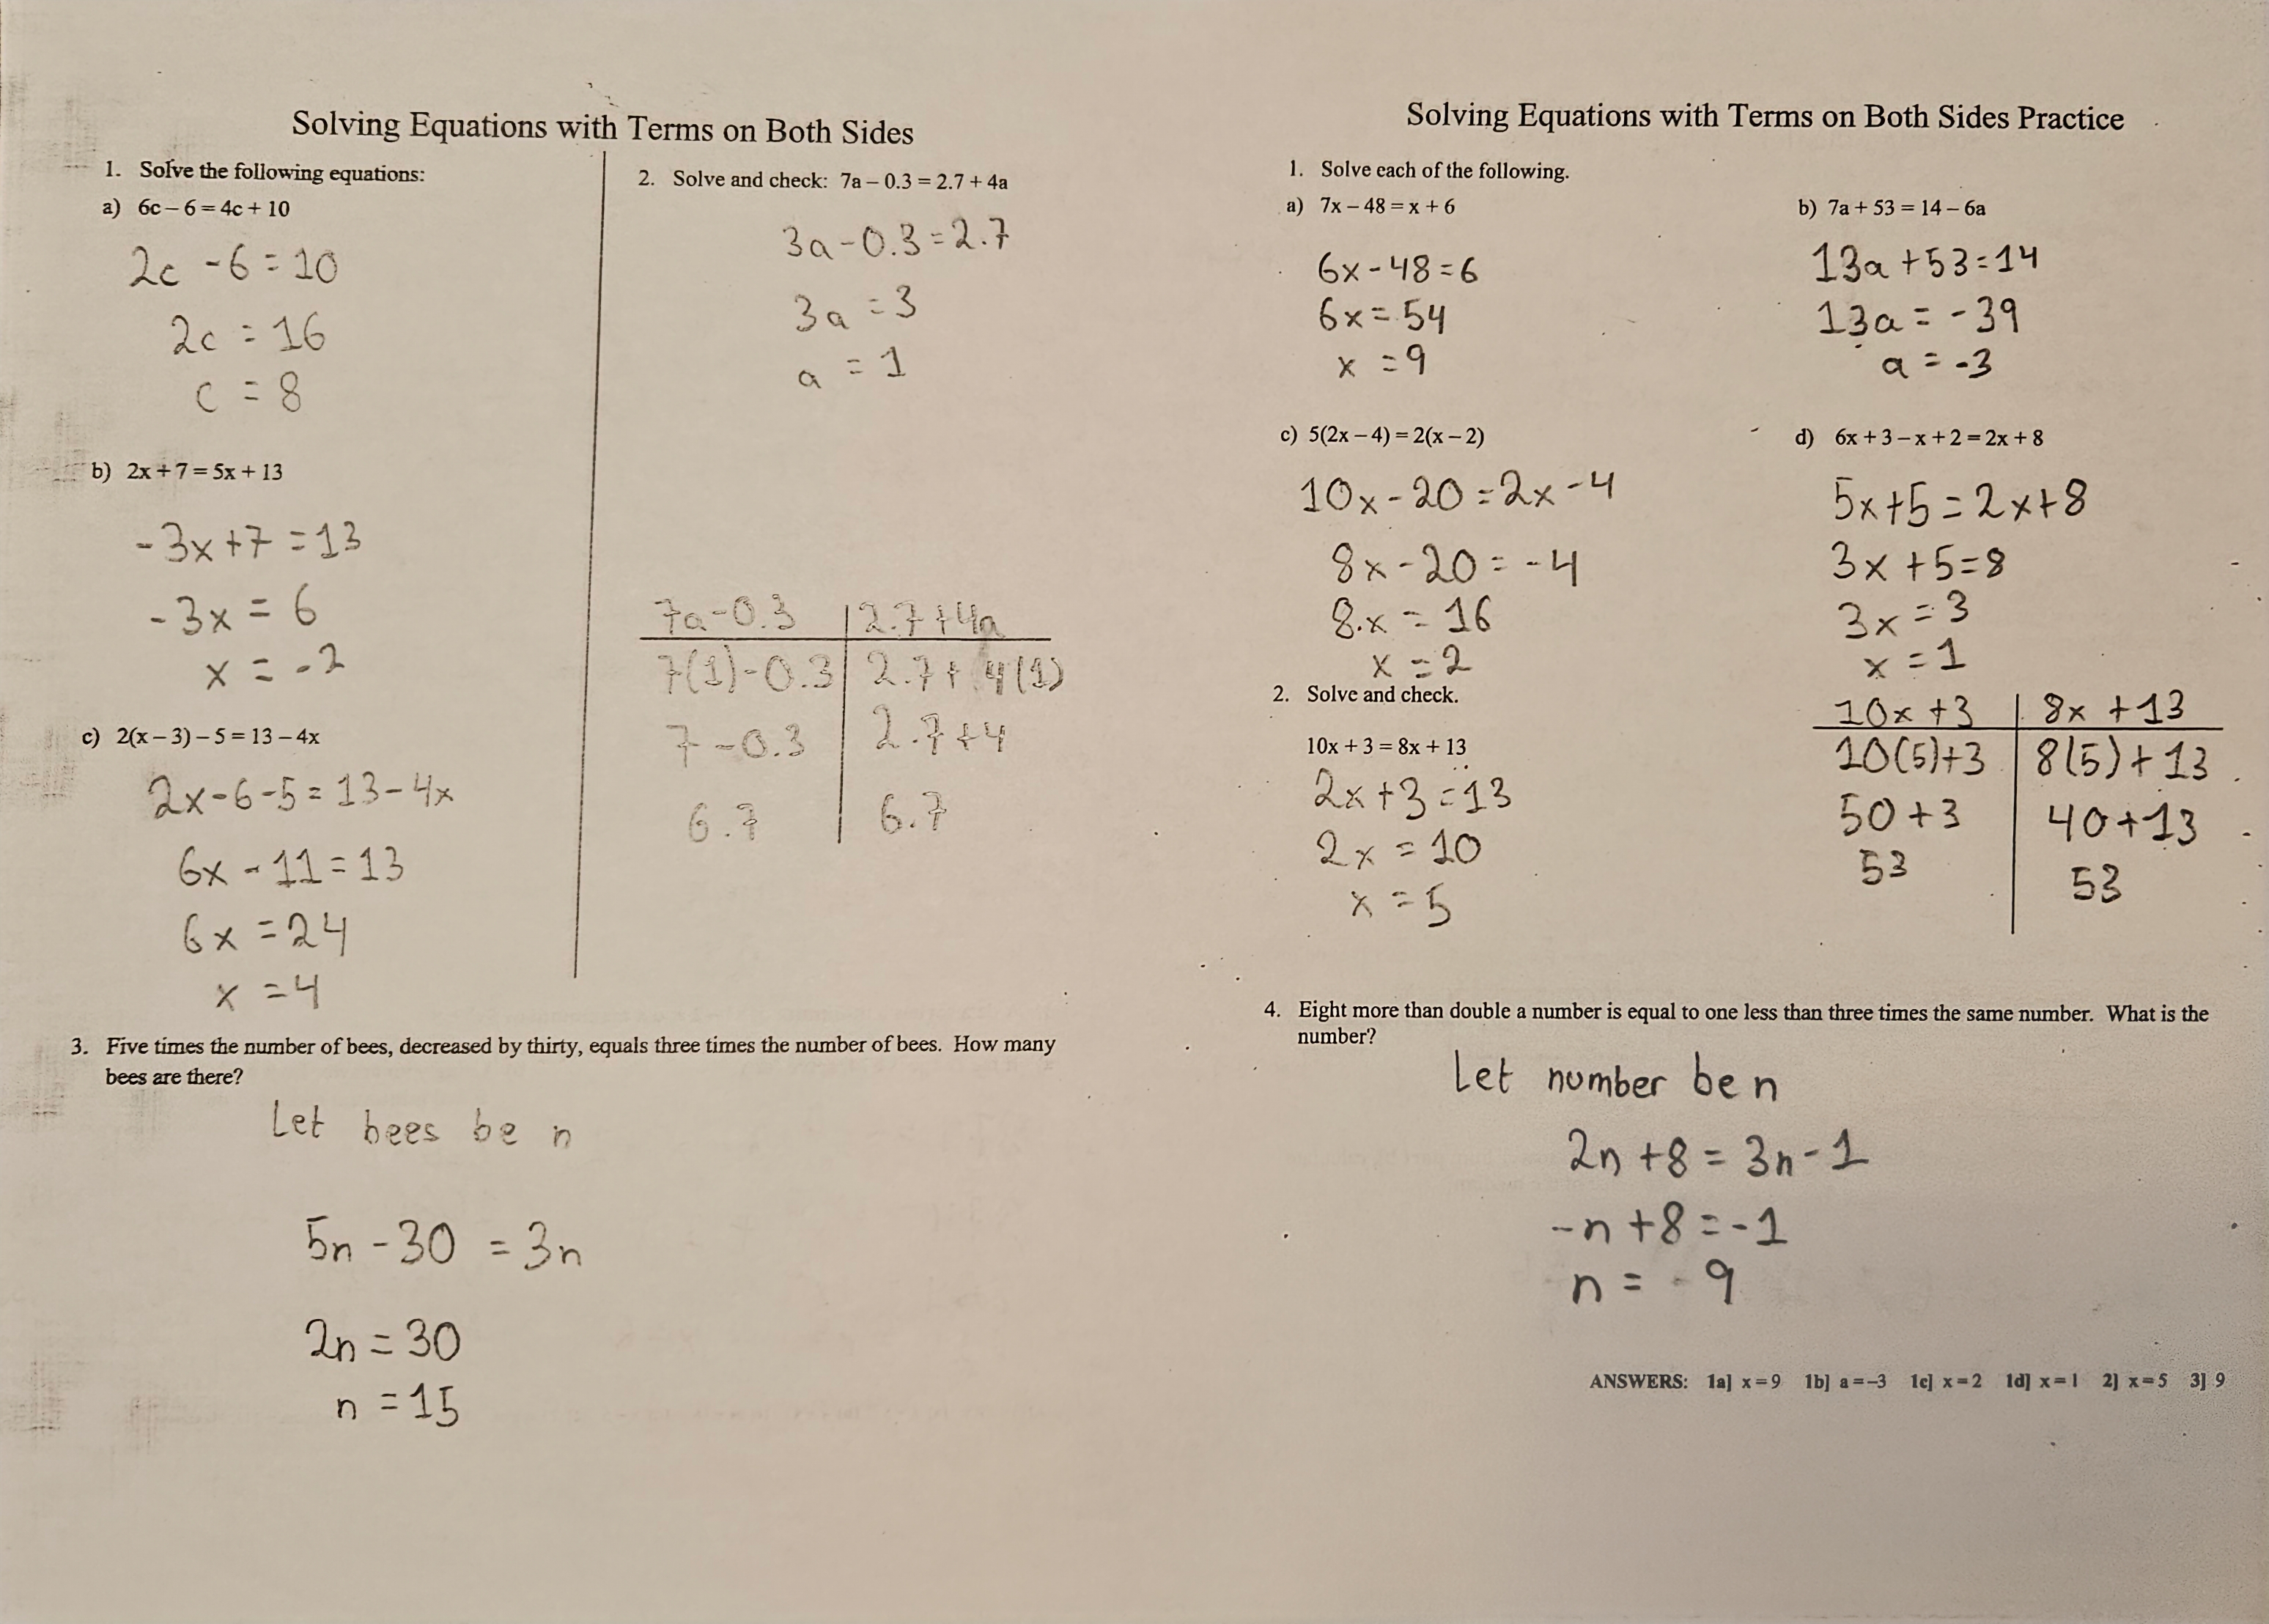
The concept of having terms of both sides are similar to not having terms on both sides. The first image below contains overall examples of this, as well as the process of it being checked.
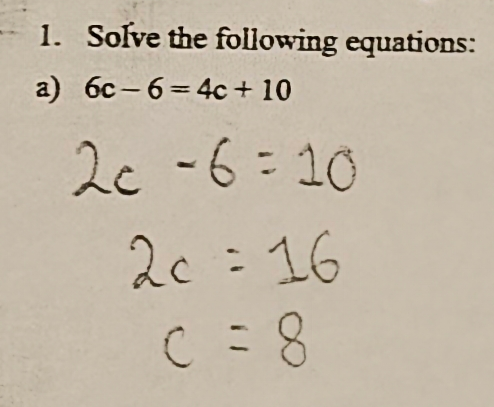
As always, the second image contains an example taken from the first page. In this question we are faced with the equation 6c - 6 = 4c + 10. The first step we need to do is to collect all the terms with variables onto one side which means we subtract 4c to 6c using reverse operations. This is possible as they are both like terms. Now we have 2c - 6 = 10. From here onward, we can use our strategy above. We'll use SAMDEB to know that we need to reverse negative 6. This will add to 10 leaving us with the equation of 2c = 16. Finally, we can divide 16 by 2 to get c = 8. Our answer can be confirmed by attempting to solve the equation, replacing c with our answer of 8.
Distributive Property
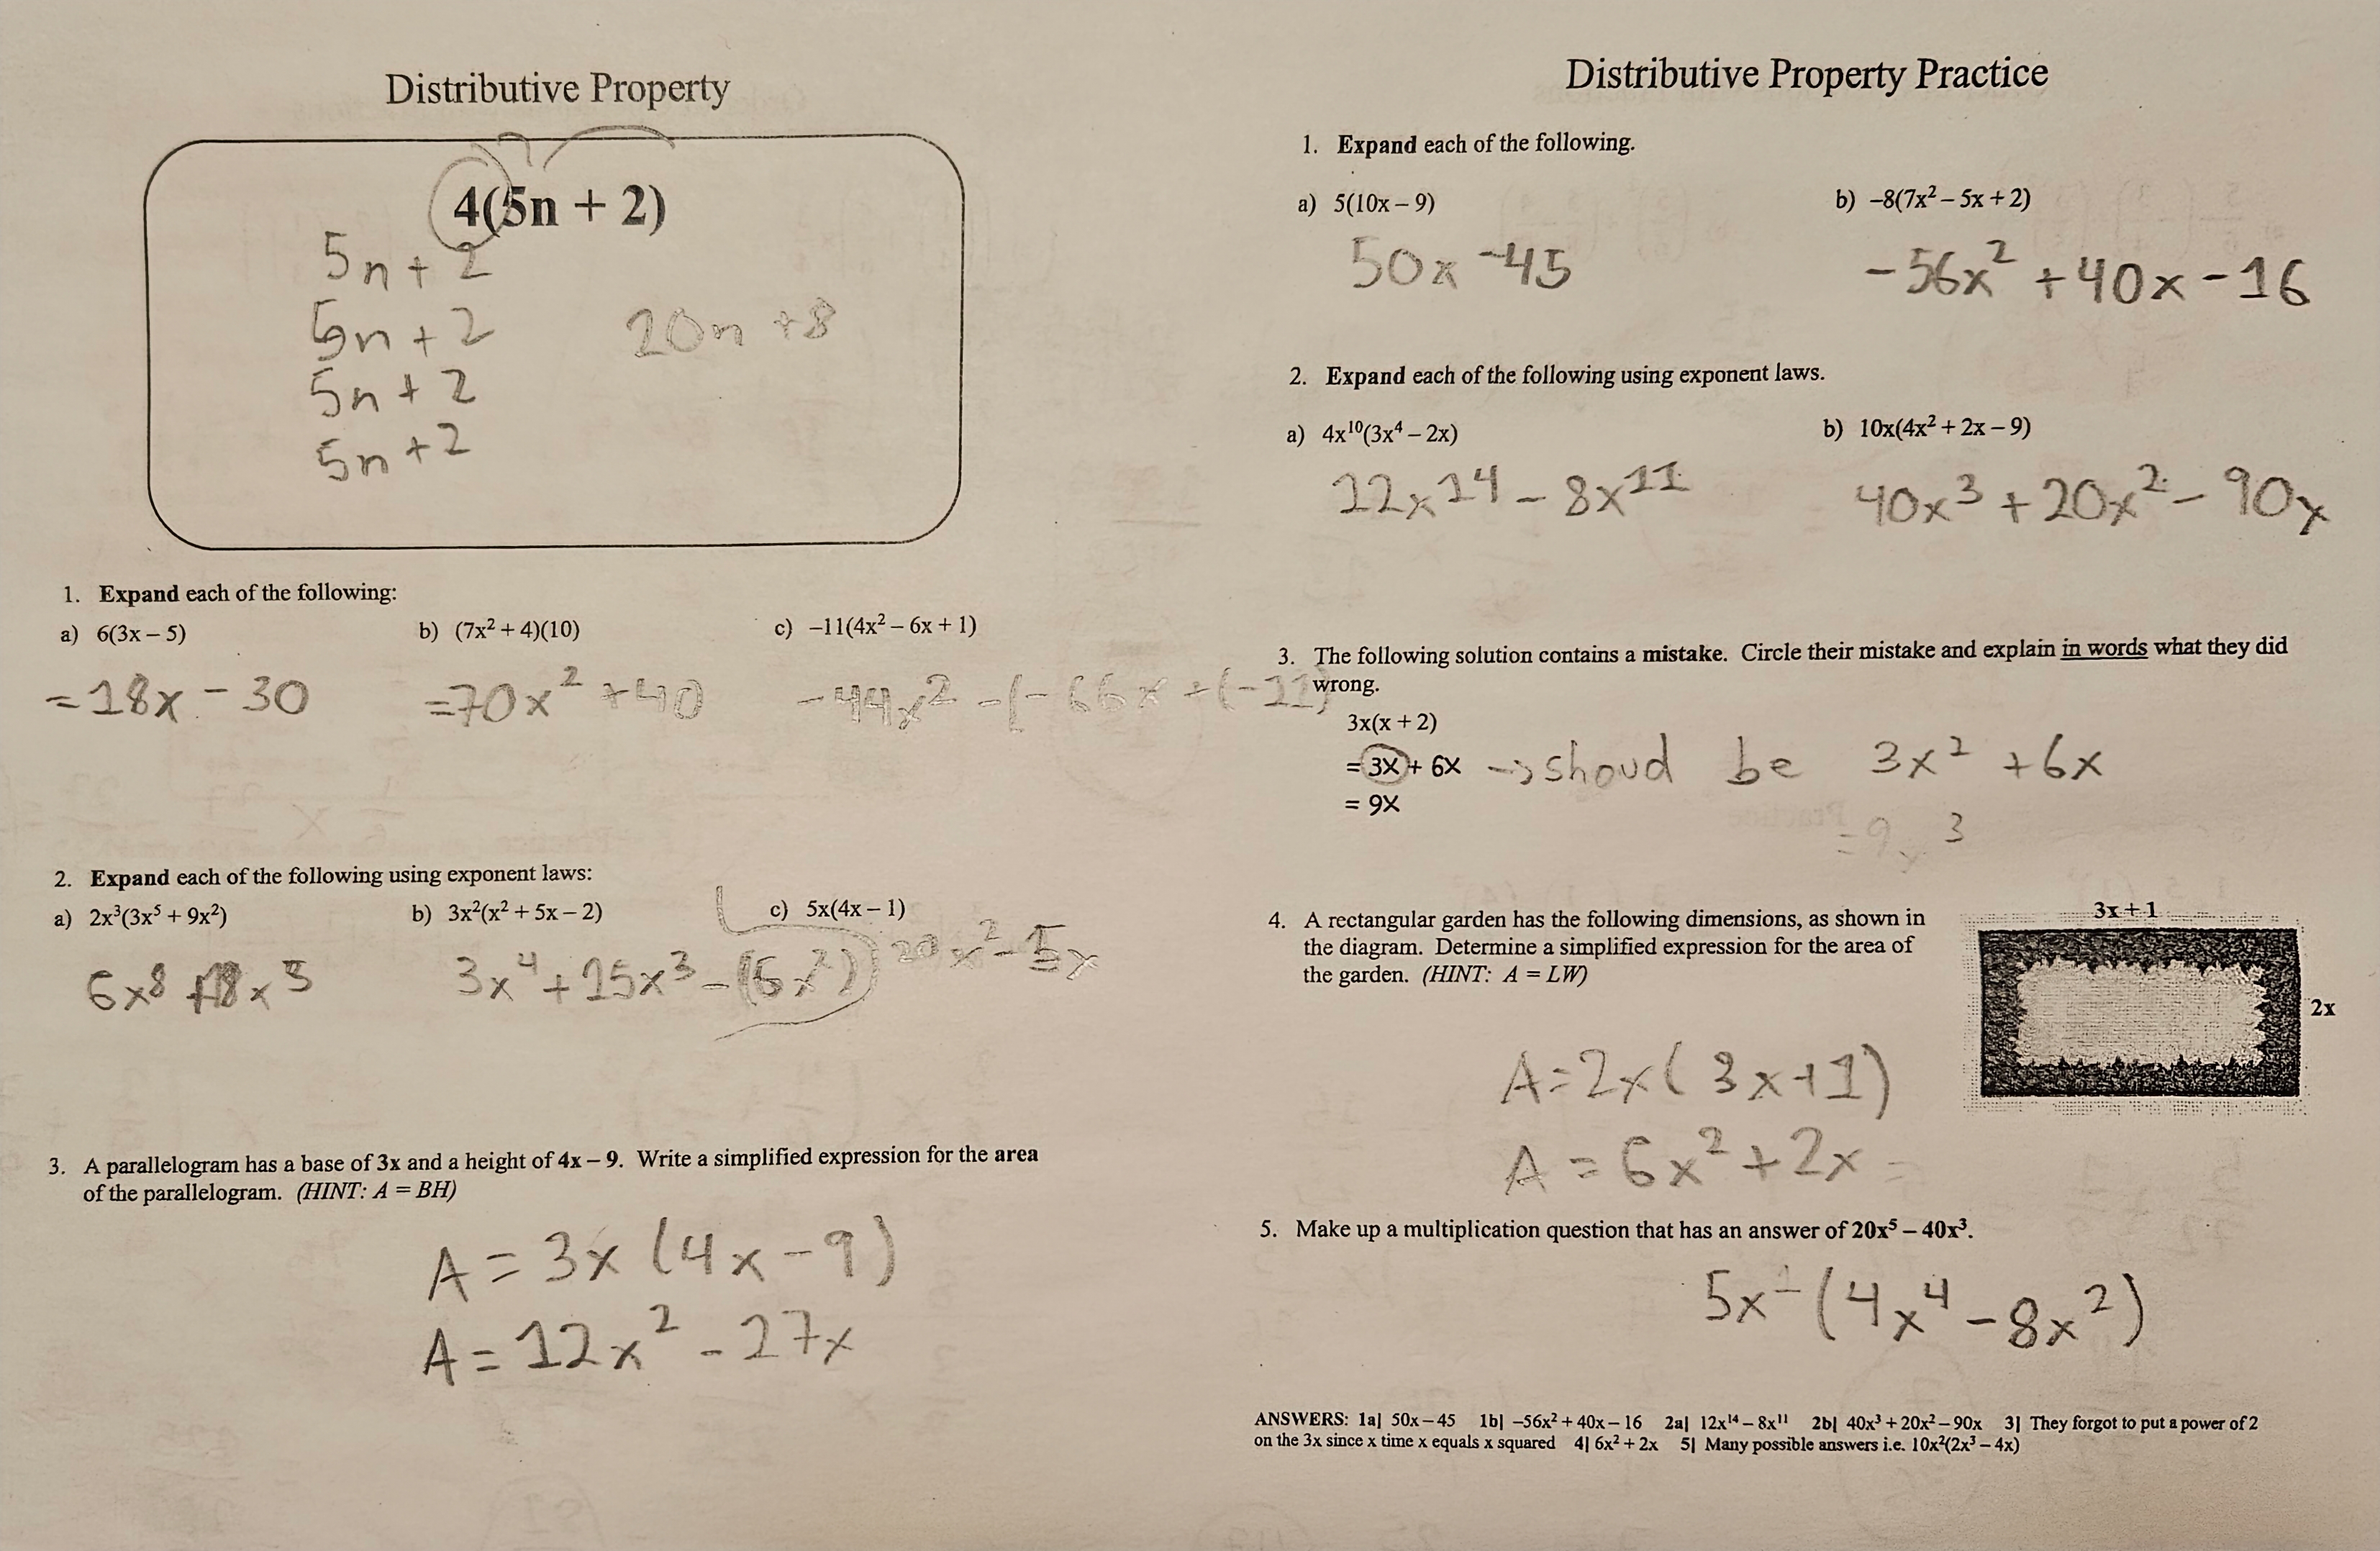
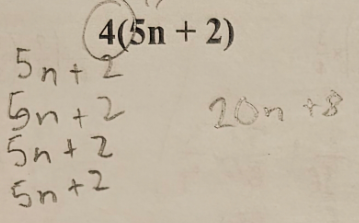
Distributive property involves having a term around an equation in brackets. As before, more examples of my work are in the first image below. The example we have here (second image) contains 4(5n + 2). We can solve this by multiplying 4 by each of the values inside the brackets. Once completed, will be left with a final answer of 20n (5n * 4) + 8 (2 * 4). As explained, 4 is essentially being multiplied by the amounts. A simpler, more visual method is also used in the image example.
Marble Slide Favourite
During the end of the year, we were assigned a Marble Slide Challenge Desmos activity. This involved making digital marbles roll down lines, created by our algabraic formulas. The goal of the activity overall was to make the marbles hit every star given on each page.
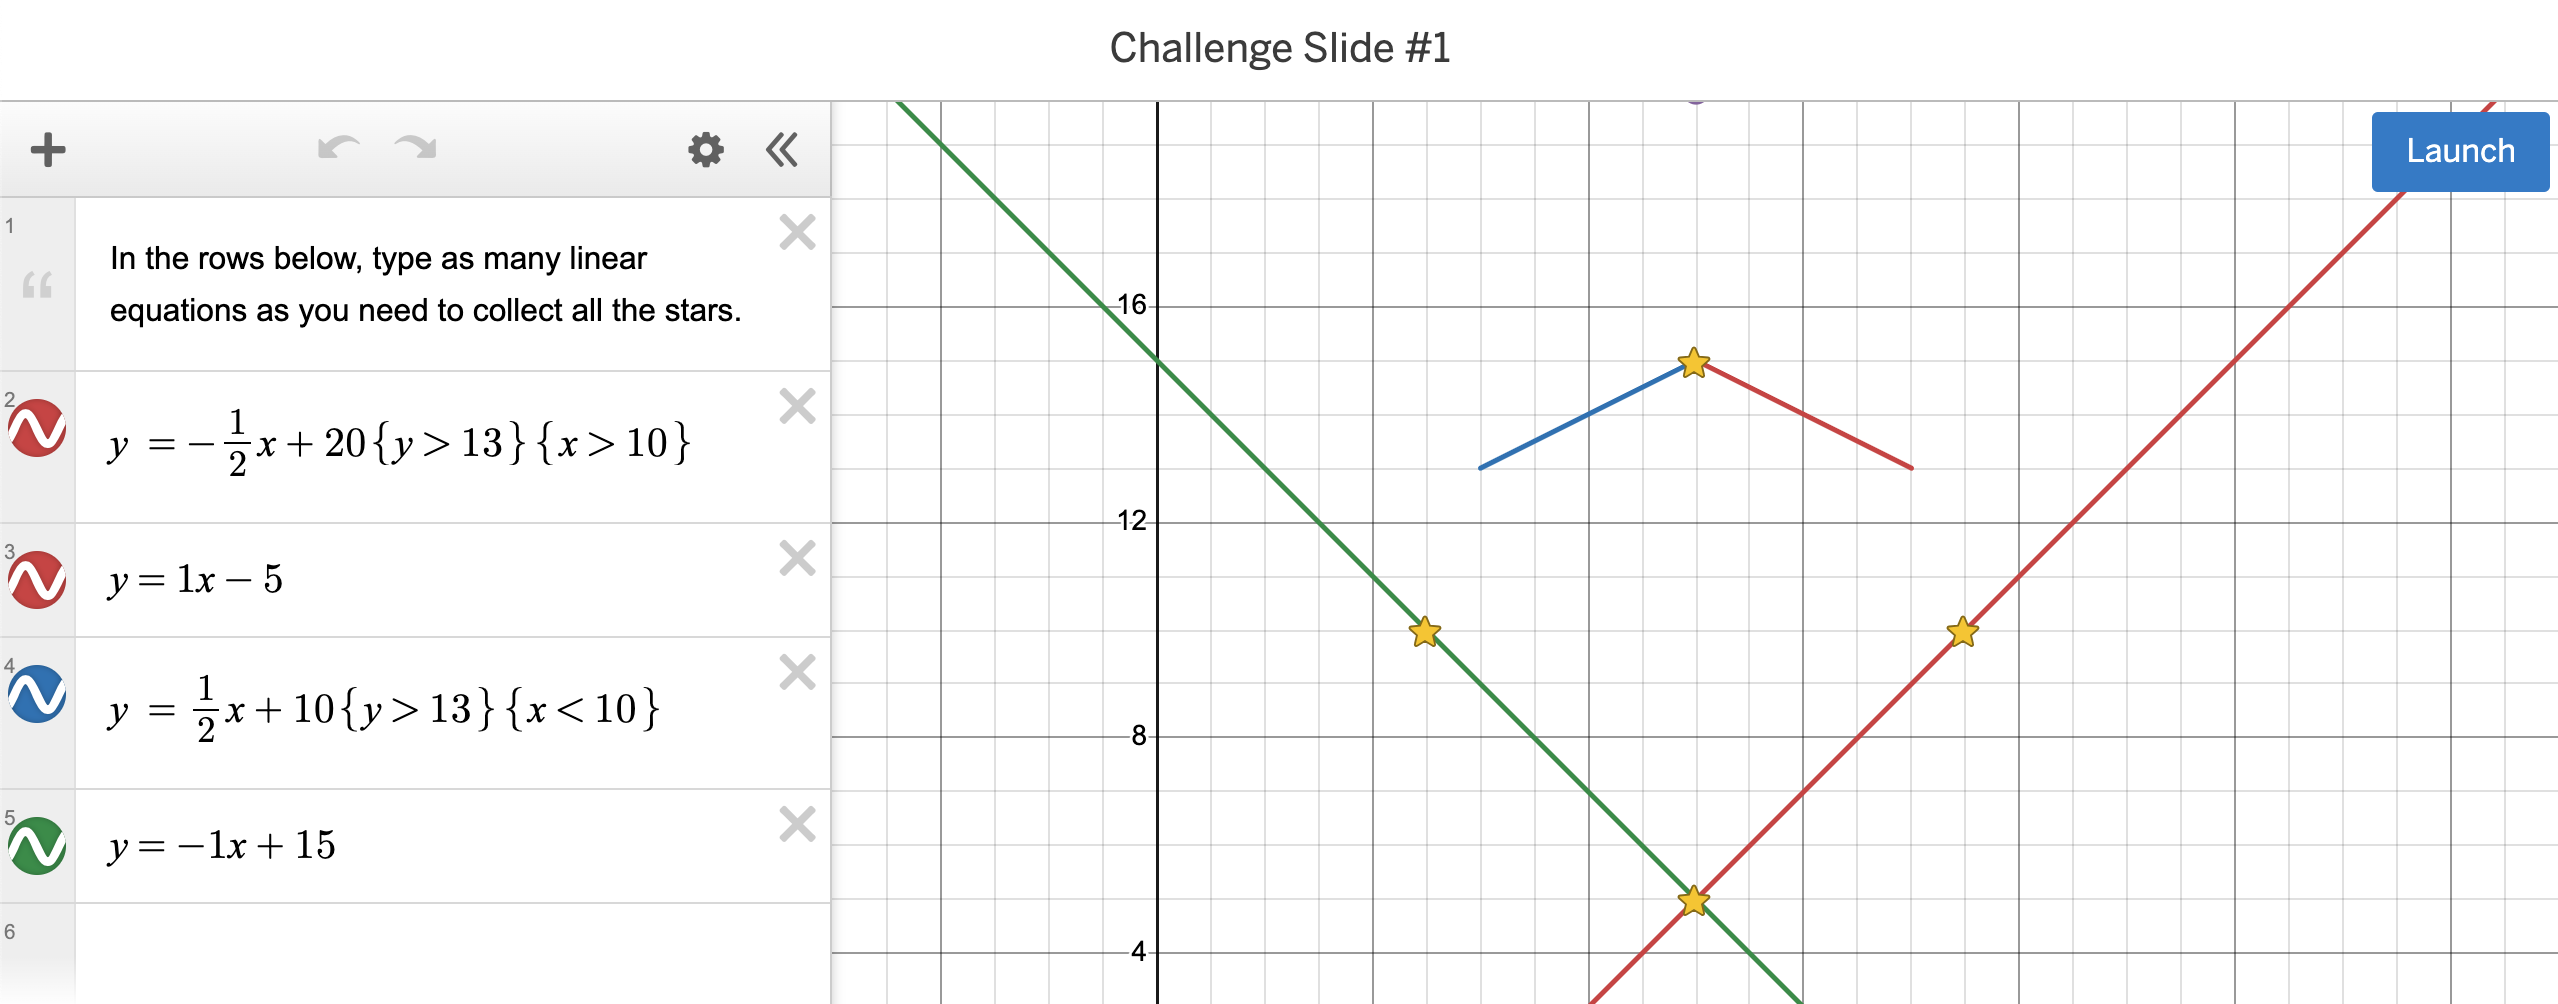
Above attached is my favourite marble slide challenge. This was a challenge I personally felt was very challenging, but was fun to solve as I kept experimenting with different lines in order to get the marbles to hit the stars. Eventually, I ended up with 2 lines down the middle, splitting the direction of the marbles onto both sides, where they then fall into ramps covering the other stars. One of the challenges I faced was precisely placing each line. I learnt that you can determine limits for the length of a line segment using a formula.
We'll go over the first line as an example. The formula is y = -1/2x + 20{y > 13}{x > 10}. First -1/2 is the slope, meaning we are going 1 down and 2 to the right. Next comes the y-intercept, which is 20. This means that the line if continued forever will go through (0, 20). Parameters for the line segment is being written at the end. First {y > 13} means that the line will continue until y is no longer greater than 13. Likewise, {x > 10} shows that the segment will continue until x > 10.
Overall, my work on this task shows understanding of the equation y = mx + b, by explaining the slope (steepness of the line), as well as the y-intercept (where the line goes through). I have demonstrated this by placing lines at exact points by changing these values, as well as limiting the length of the segment.
Data Management
I have learnt a lot about data management earlier this year, and I have learnt multiple ways of managing such data. I can use my data management techniques to convey data information such as patterns. I can use concepts such as interpolation and extrapolation (discussed later) in order to predict trends in data graphs. I can also use lines of bet fit in order to predict whether a value is increasing or decreasing, etc.
One & Two Variable Data Collection
One variable - Favourite colours
| Student Name | Favourite Colour |
|---|---|
| Sougato | Purple |
| Vanessa | Pink |
| Janet | Red |
Two variable - Questions completed and correct
| Student Name | Completed | Correct |
|---|---|---|
| Sougato | 50 | 50 |
| Vanessa | 49 | 2 |
| Janet | 10 | 9 |
The main types of data being collected is one and two variable data collection, which can be benifitial in different situations. One variable data collection is when the data being collected is only being collected with one main piece of information in mind. An example of this is the favourite colours of students in a class. This is because the only variable being measured is the students' favourite colour. 2 variable data collection on the other hand, is collecting 2 pieces of data. An example of this is the amount of questions completed by students in a class, and how many they got correctly. This instance has 2 variables, which overall allows us to look at the rate of correct answers by students.
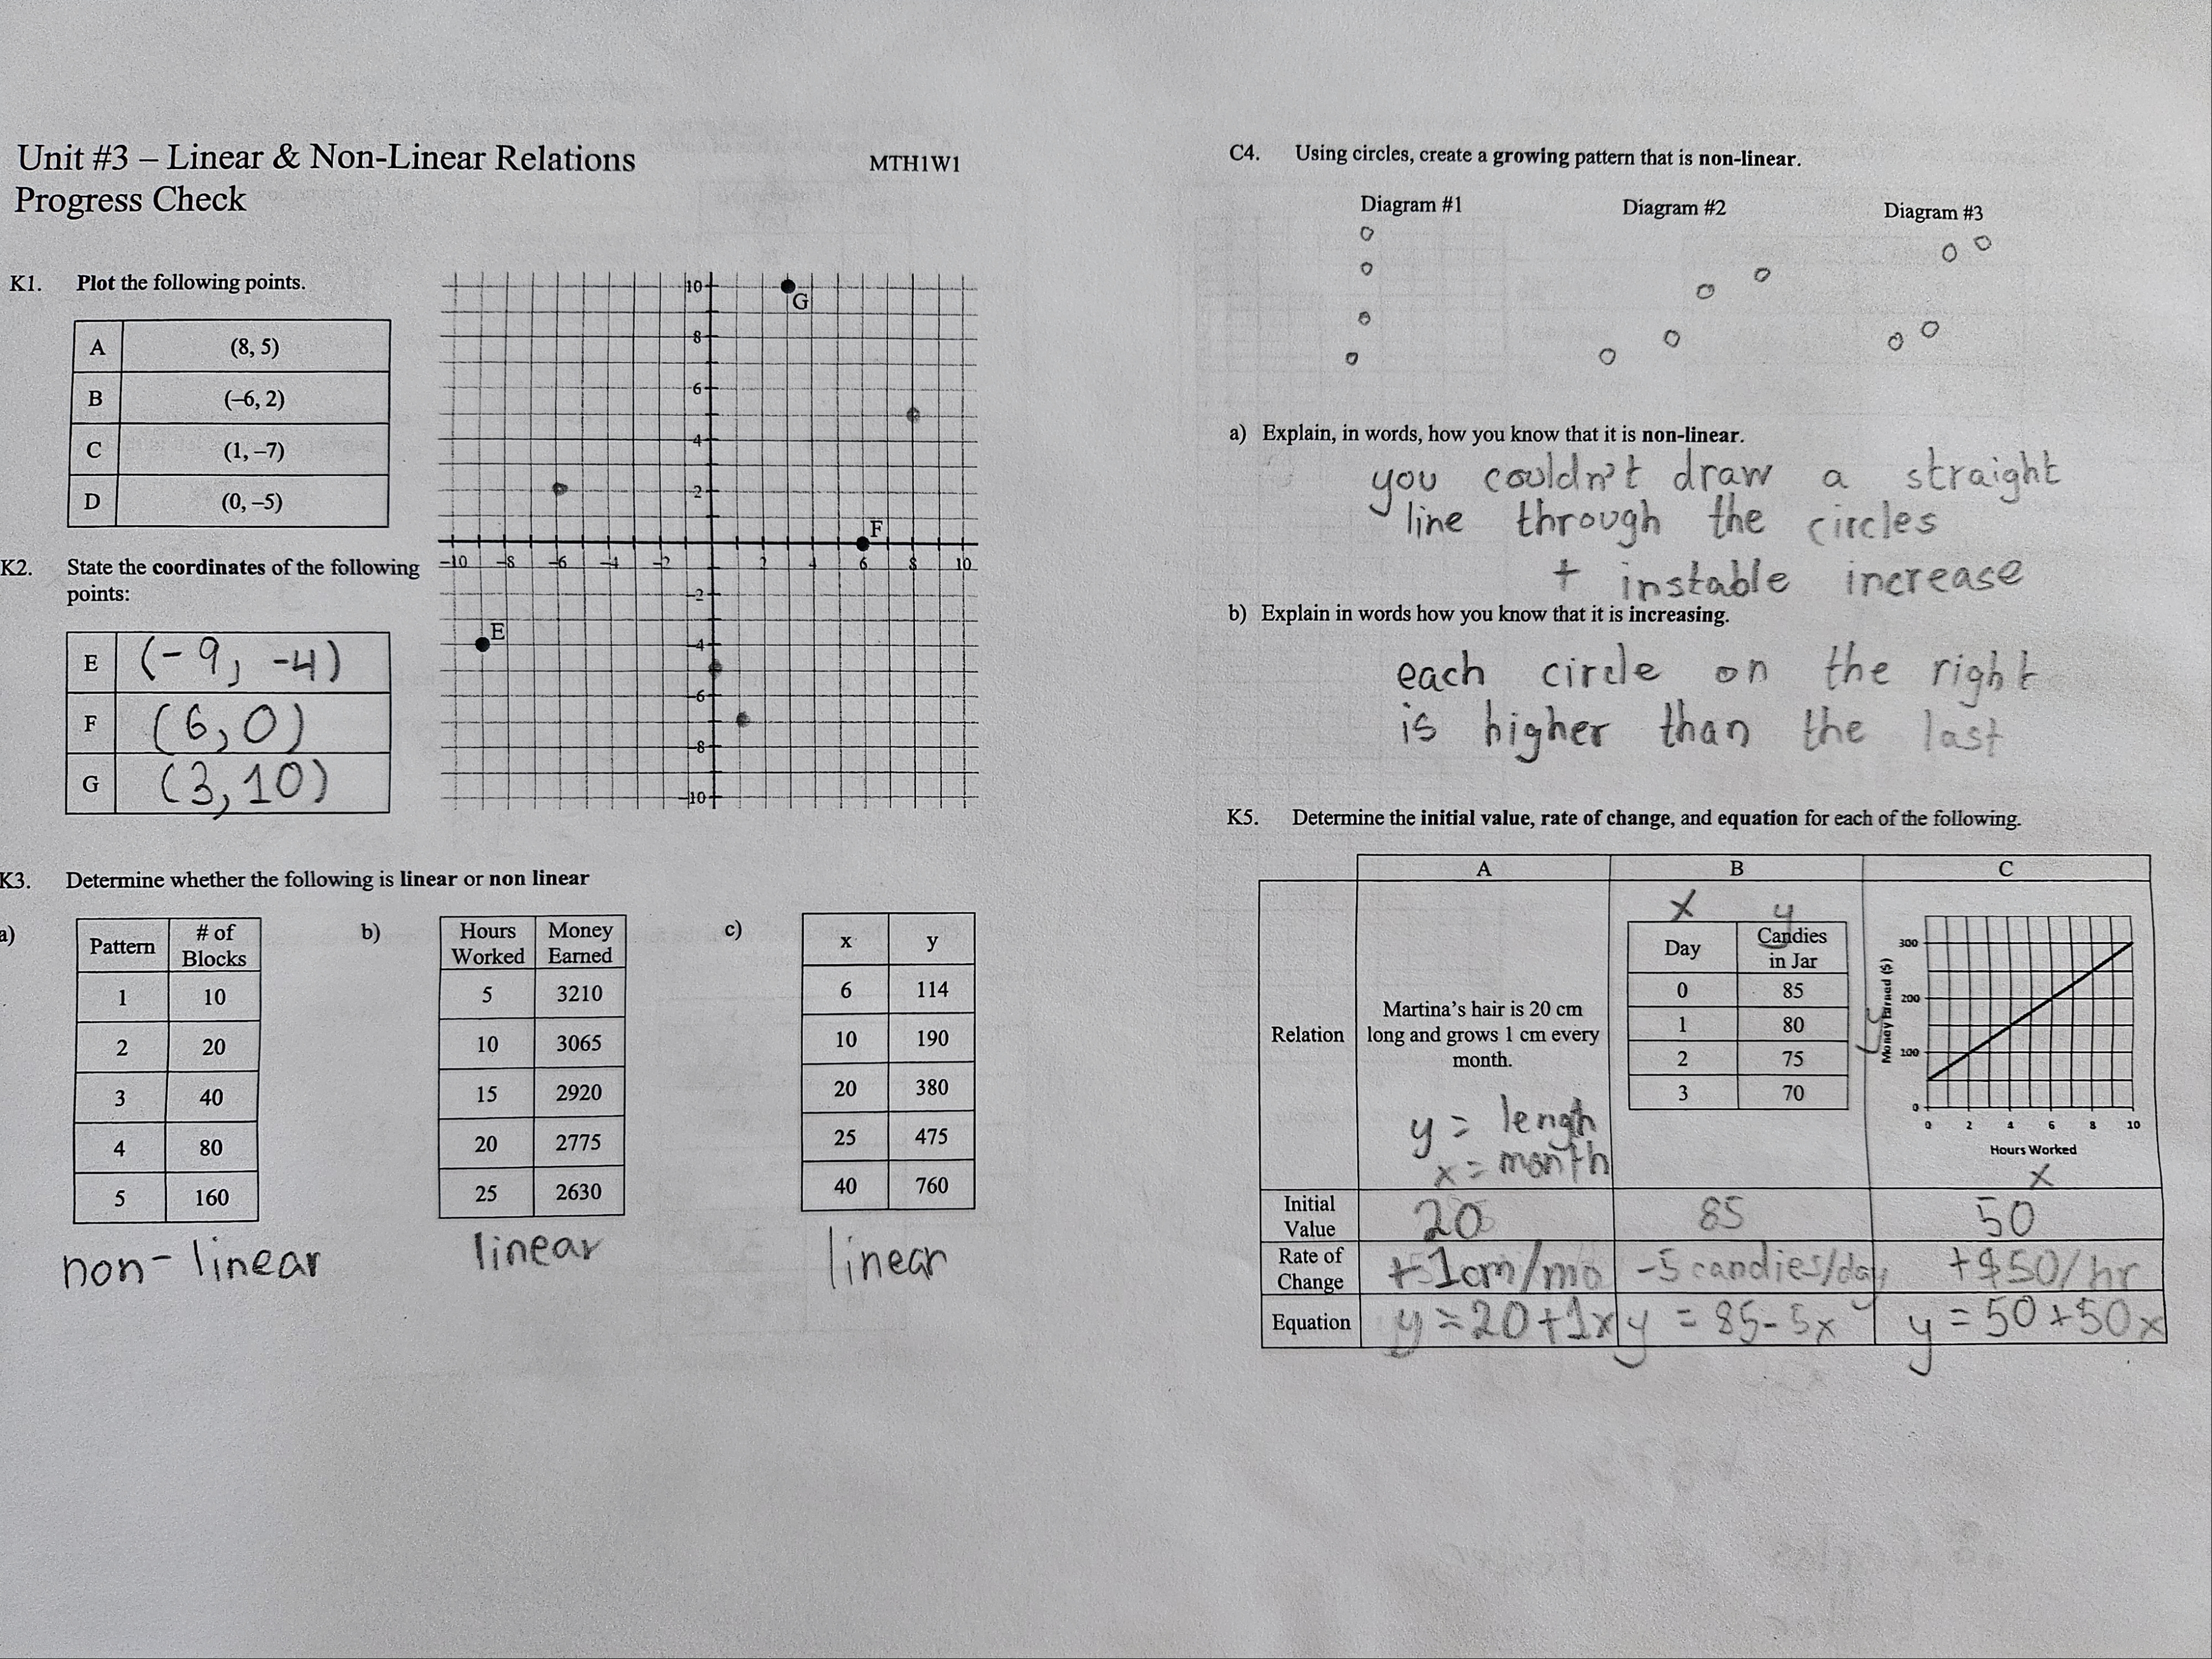
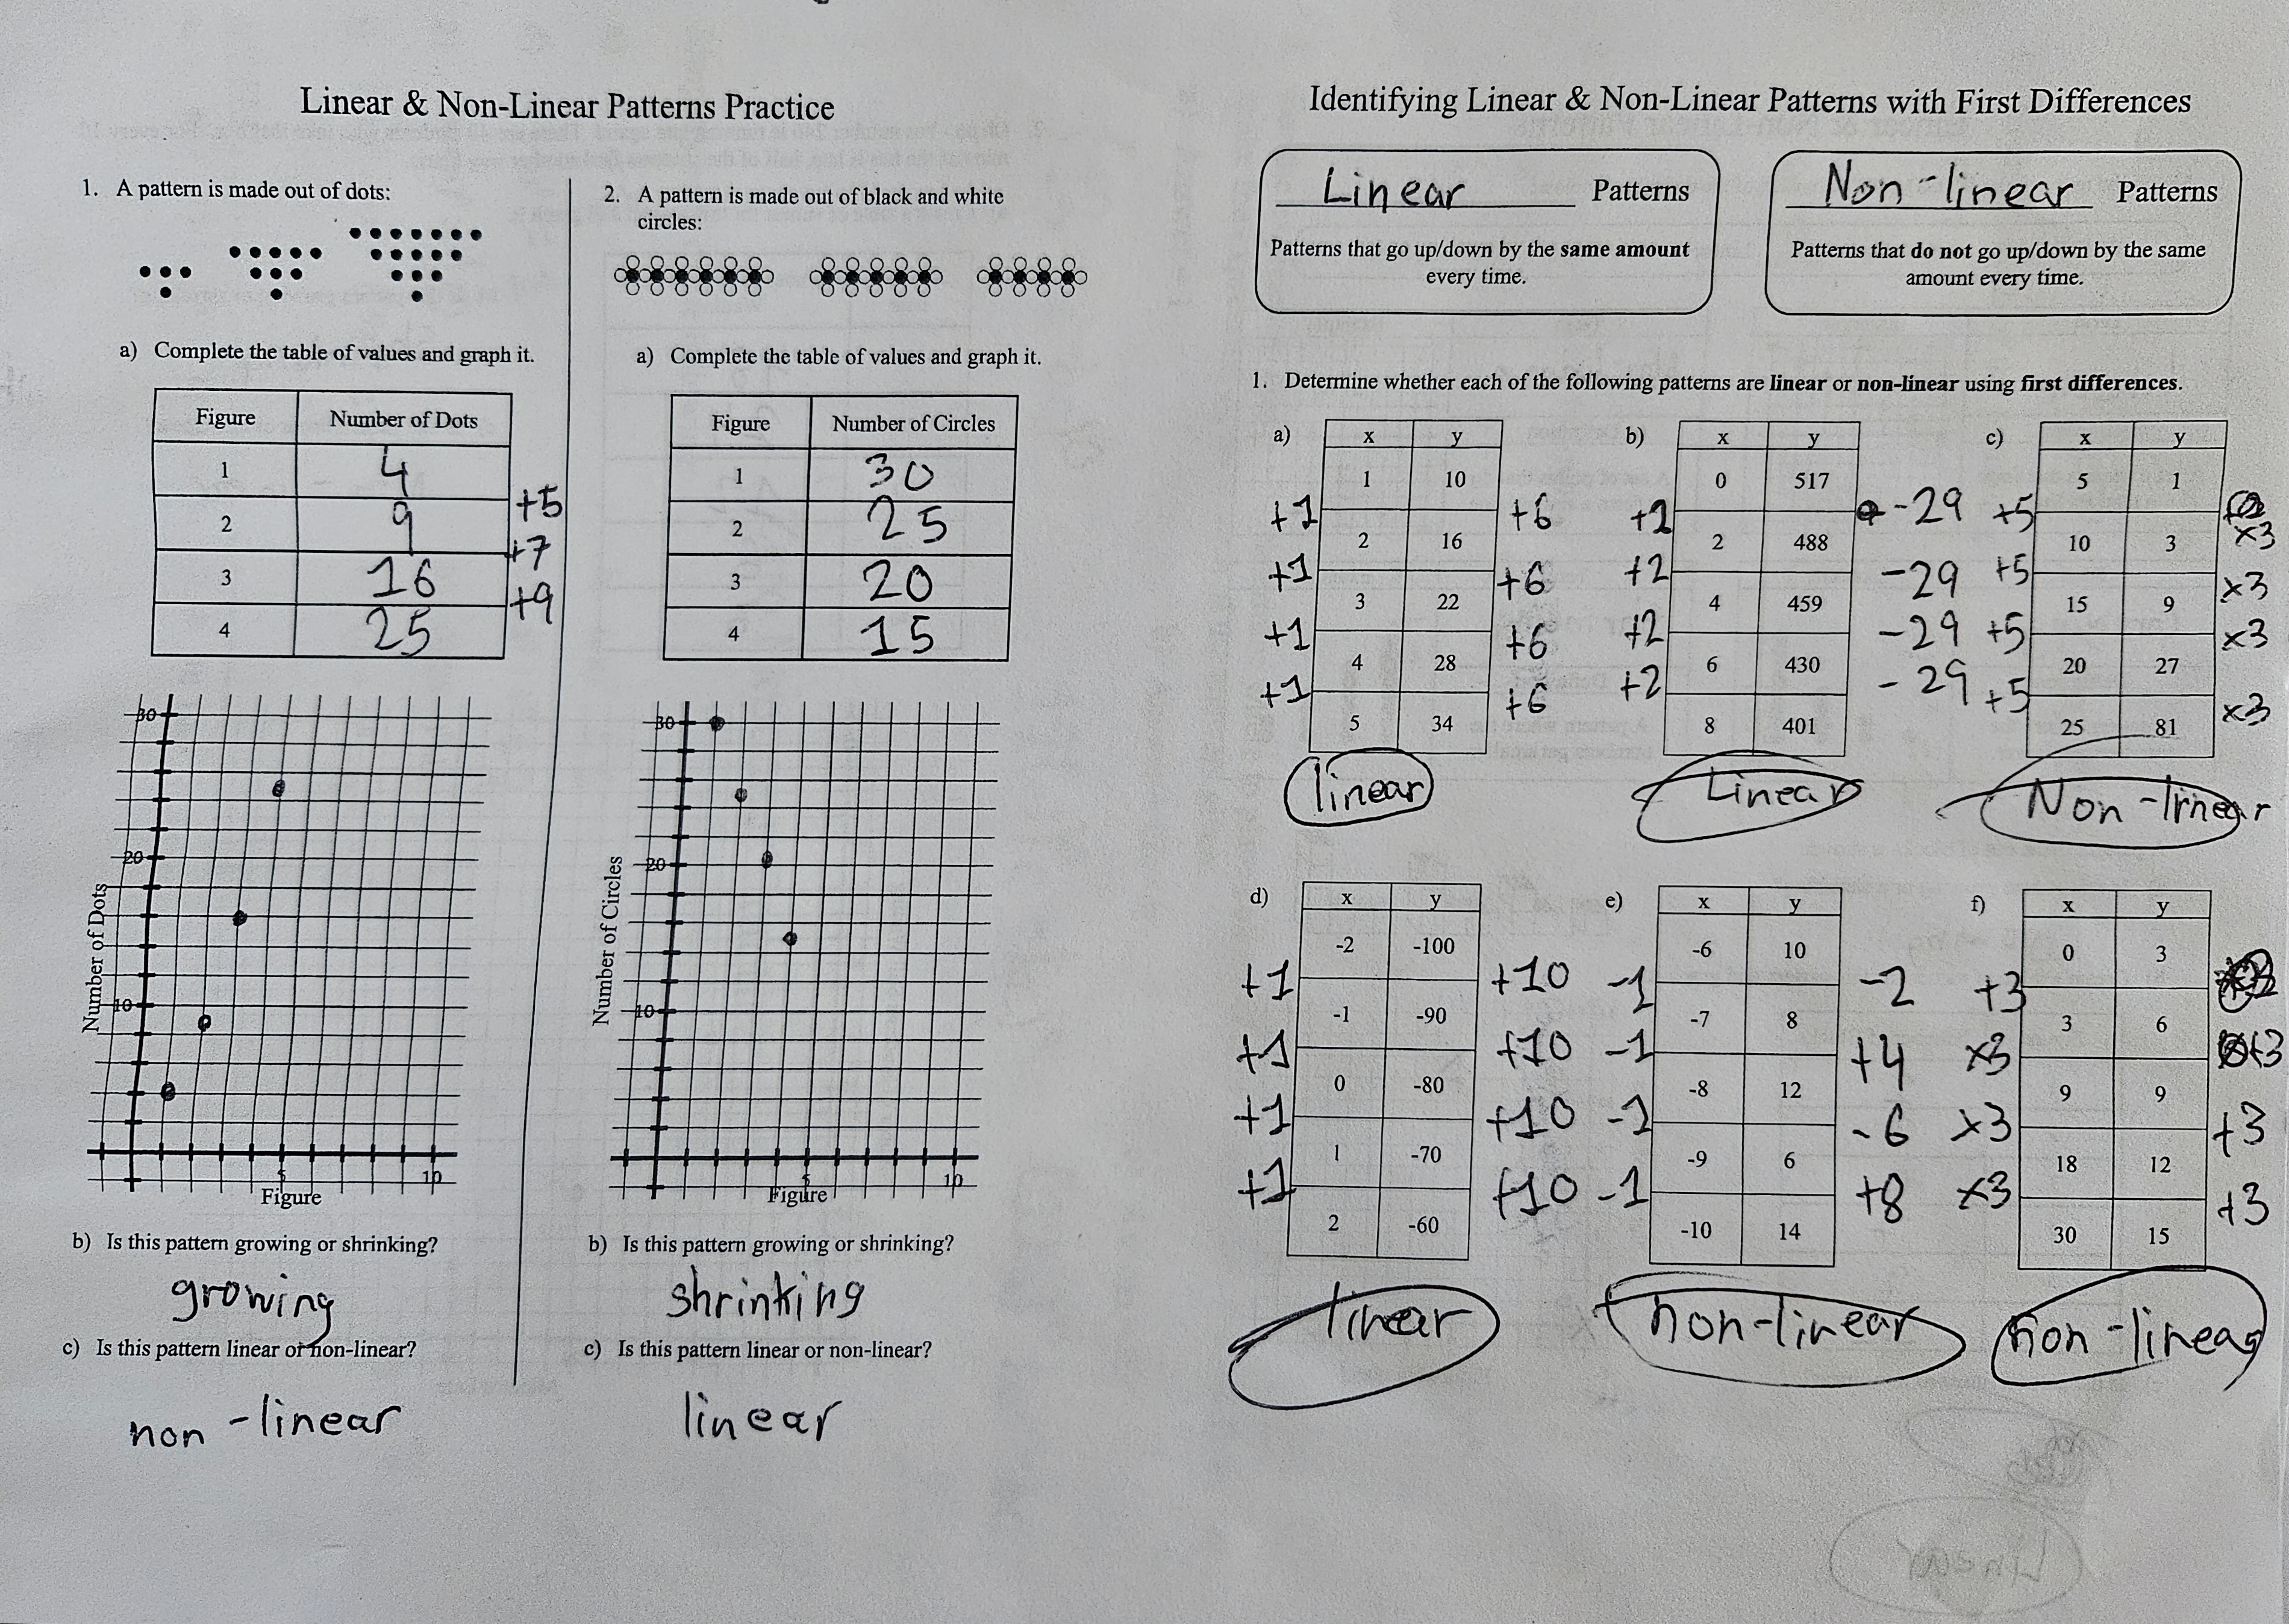
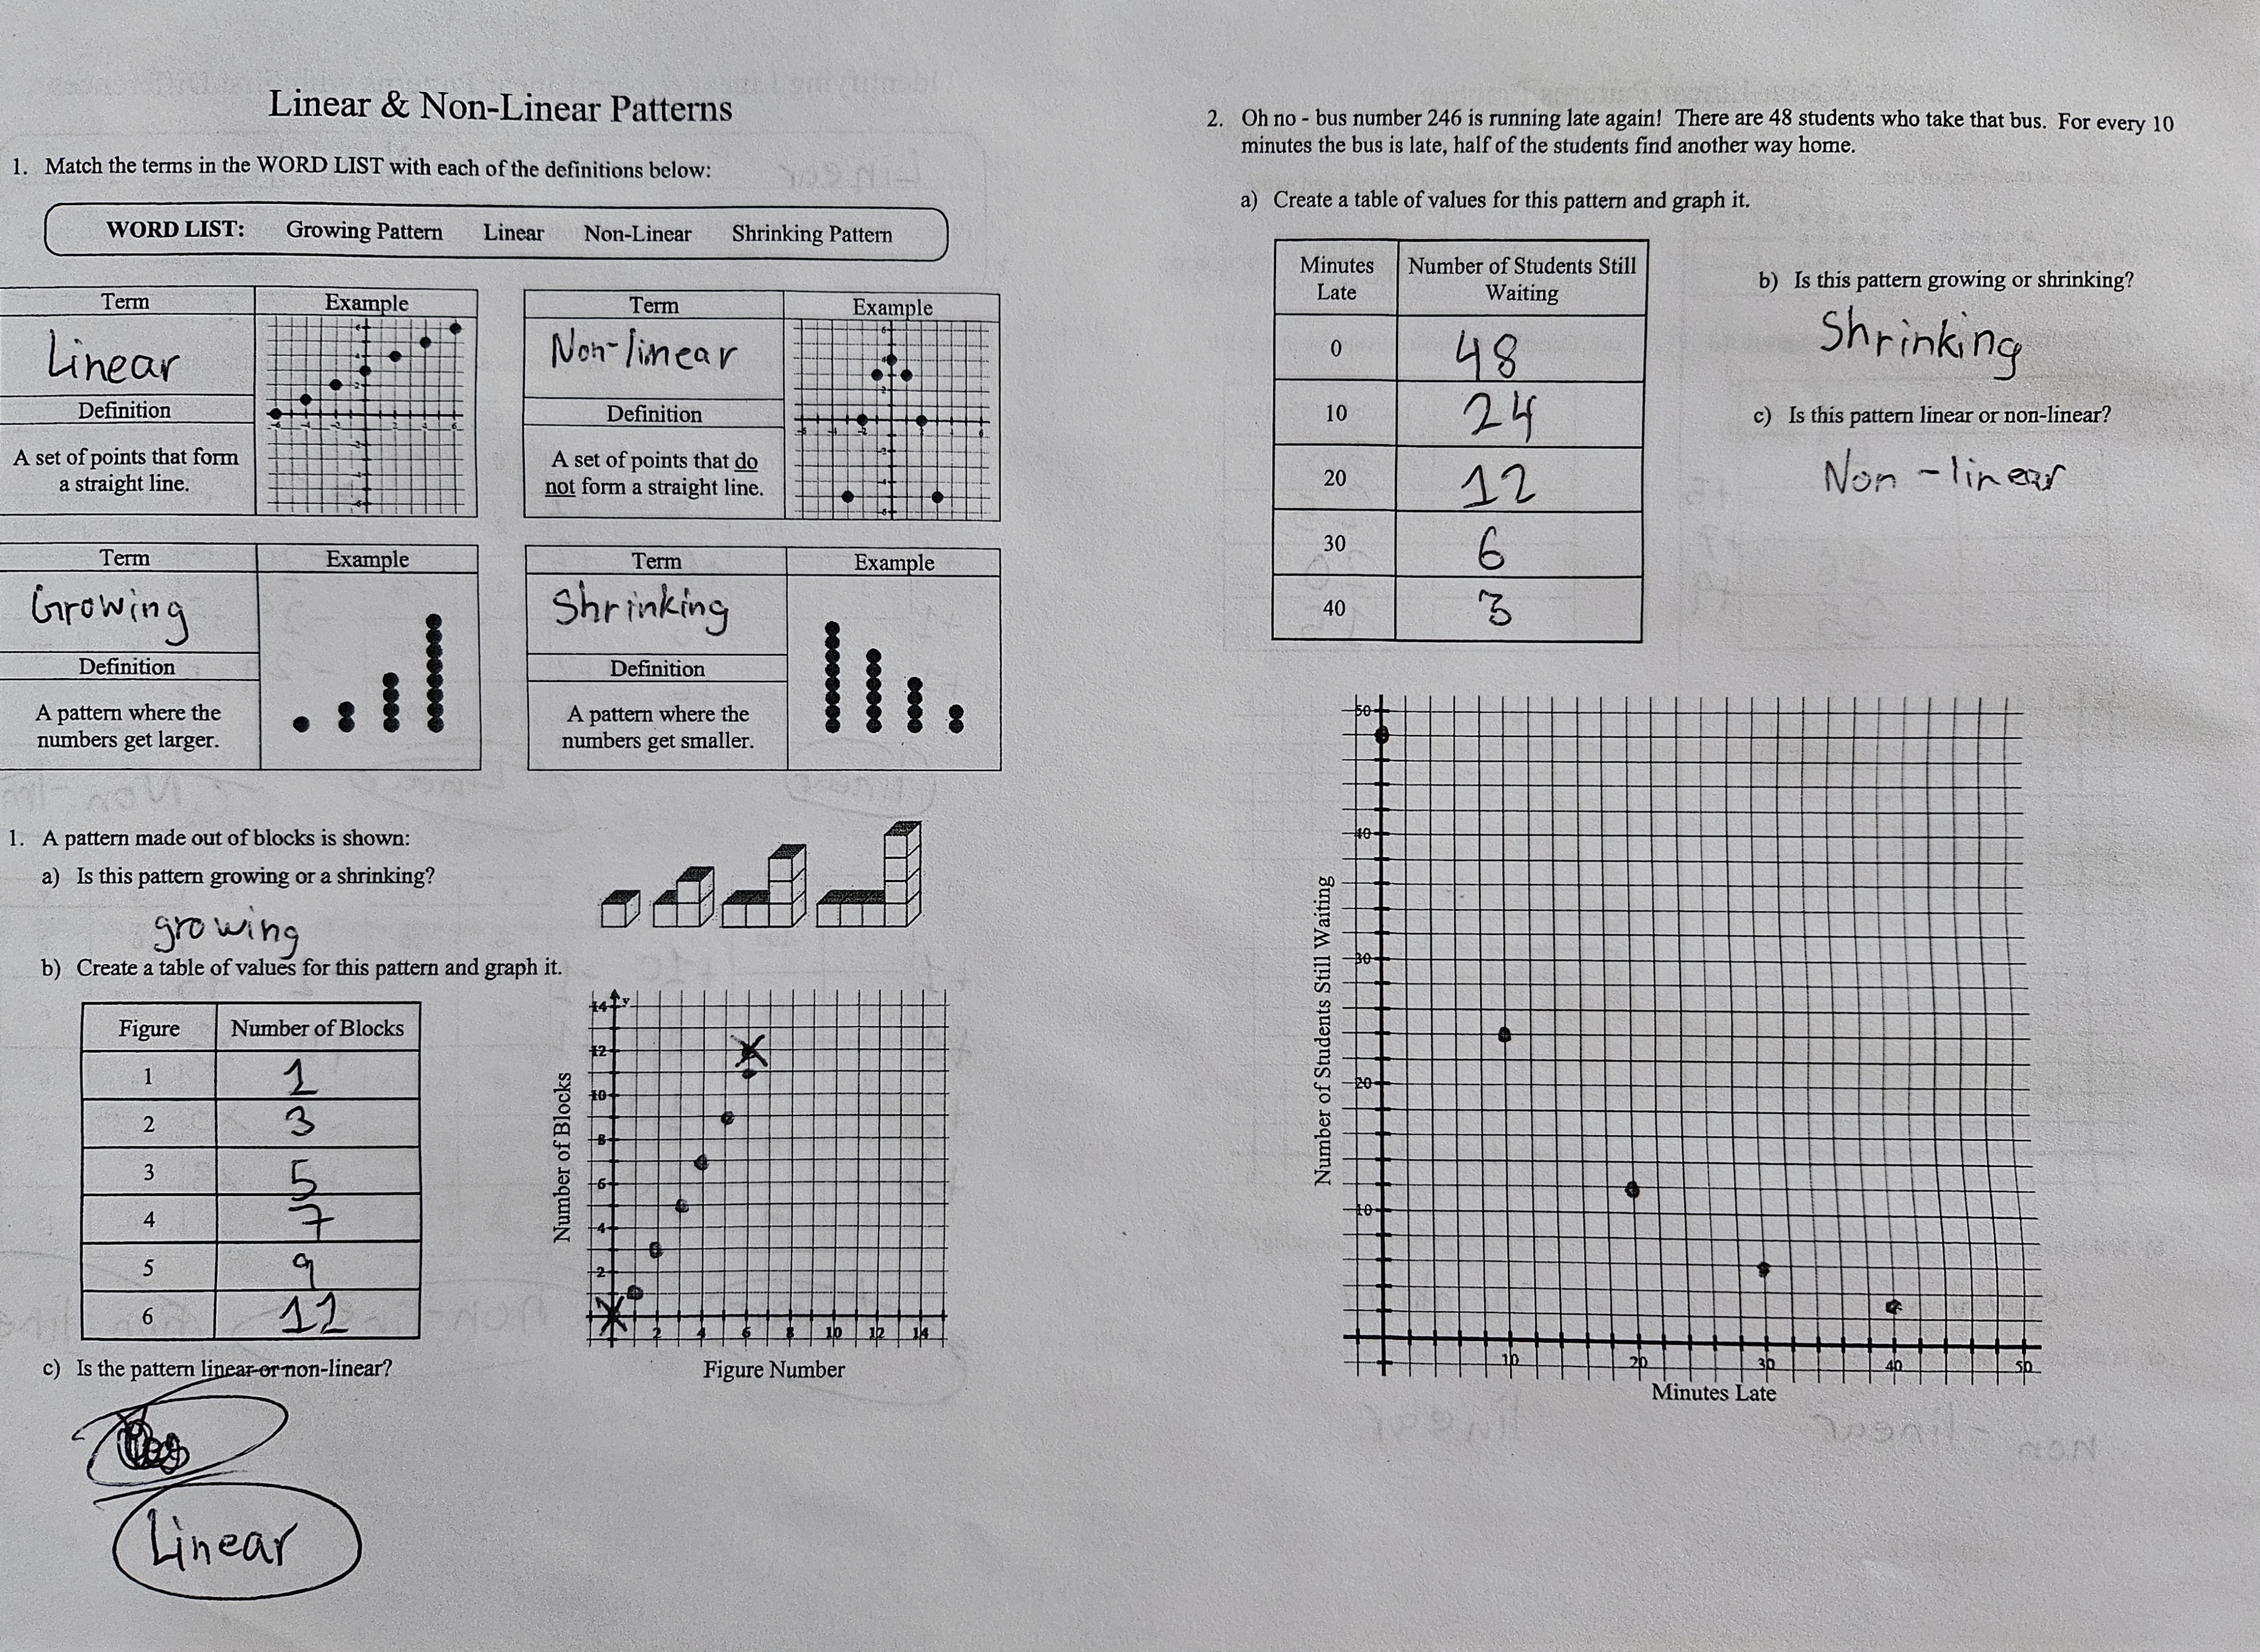
The images above show some classwork of linear and non-linear patterns. Linear patterns are where there is a consistent change in value whereas non linear patterns are inconsistent. Due to the nature of linear patterns, they are easier to predict, as they will have a straight line of best fit. We can find these pattern from the table, where we can check whether the differences between each y value is the same.
Mean, Median, Mode
There are 3 main ways of getting an overall number for a set of values.
Mean - Average of all values.
Median - Middle number of all values.
Mode - Value with most appearances in the list.
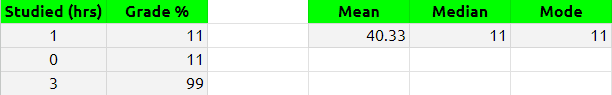
The image above contains a table of grades by hours studied. Although the study hours are irrelevant in this context, it displays the mean, median and mode of the grades. | The mean is calculated by adding 11, 11 and 99 which is 121 and then divided by 3 (the amount of values) which leaves us with the answer of 40.33̅. | There is no specific middle number here, but the median would be 11 taken from the mode. | Finally, the mode is 11, as it appears twice, making it the value with the most appearances.
Line of Best Fit, Inter and Extrapolation
The line of best fit is the line that goes through the highest and lowest point of a scatter point. This allows us to do the following:
Interpolation - Using information within the chart in order to make predictions for unknown values.
Extrapolation - Using information not provided in the chart, usually with a line of best fit in order to predict unknown values.
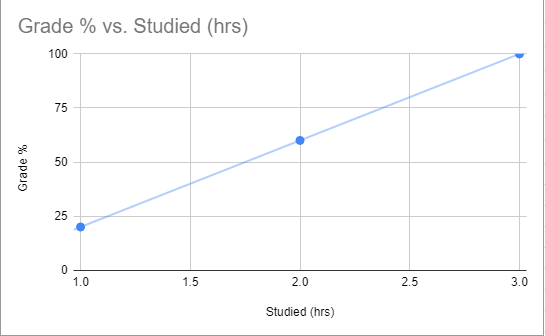
I have created an example chart above, which includes a scatter plot with a line of best fit. We can perform interpolation by guessing a value within this chart, for example, we can a infer that if a student studies for 1.5 hours which is a value in between 1 and 2 hours, their mark will be 40%, which is inbetween the plots of 20% and 60%. To perform extrapolation, we'll make the educated guess of a student's grade theoretically being 140% if they study for 4 hours. I know this because every hour studied on this chart, the grade increases by 40%.
Other concepts
Over the data unit, we also covered:
- Outliers: Values in a set that differ extremely from the rest of the other values.
- Box and whisker plots: A type of graph that allows us to split data into quartiles and see how much of our data is on each side of the median.
- Coordinates: A placement of a plot based on certain x (horizontal) and y (vertical) values. (x, y)
Geometry and Measurement
Role in Real World Scenarios
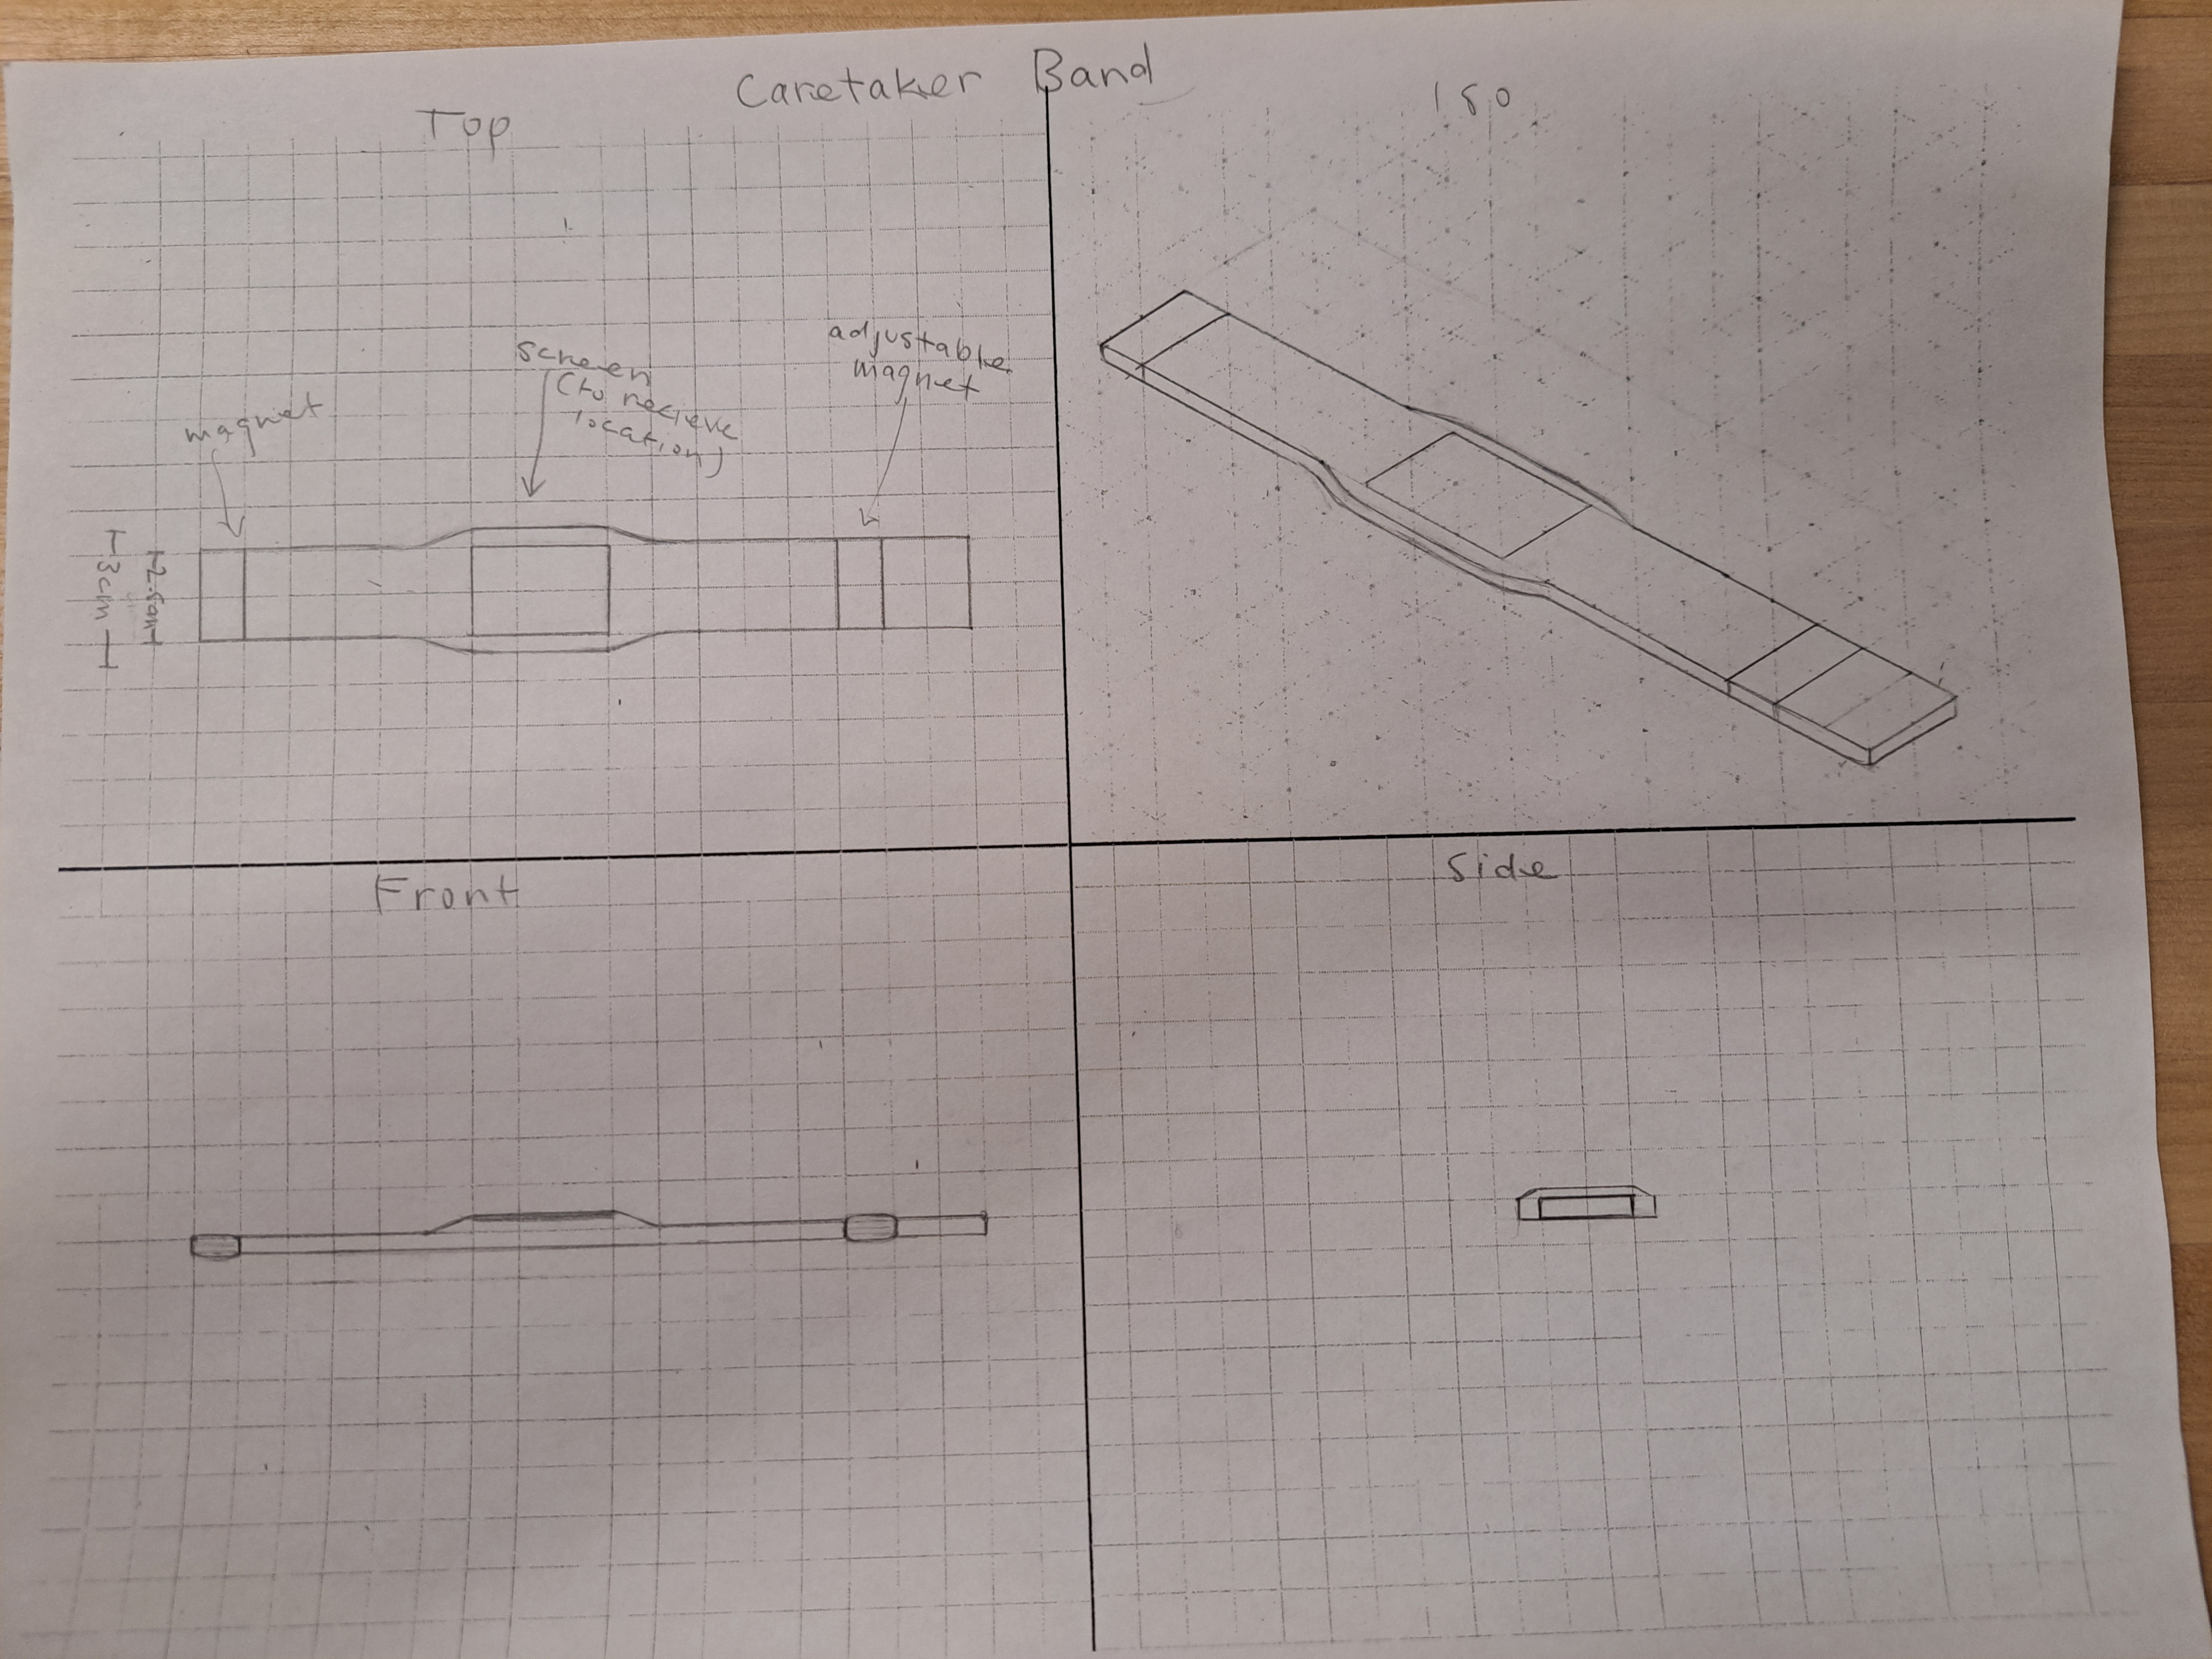
Geometry and measurement is an important real life math concept we learnt in class. One way it is useful in real life is for orthographic sketches of 3D models. This is something we used in various I-STEM projects in order to plan out our design before printing/modelling. We were able to use geometry concepts such as volume, surface area and general measurment of shape lengths in order to provide a specific plan for our products.
Below is an example of measurement being used to label lengths on this orthographic sketch for our human centered design project.
Connection to Algebra and Data Collection
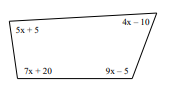
Geometry and measurement have connections to many different topics. Algebra has the connection mainly in measurement. There are many problems we faced this year, where we had to determine the value of a variable, but we are only provided with area and some side lengths. Data collection is also important. Geometry and measurement plays a large role in graphing, which is an efficient way of displaying collected data. This keeps a crucial link from data collection to measurement and geometry.
Below is an example of algebra in measurement. Each angle measurement contains an algebraic expression.